Writing data from a Bip 3 Smartwatch into InfluxDB

I've done a fair bit of playing around with my Watchy since I bought it a couple of months back and, generally, I really like it.
Unfortunately, as cool as it is, it's proven just a little too limited for what I need: if nothing else, it turns out that I really need my watch to be waterproof because I sometimes stick my arm into an aquarium without thought for my watch.
So, I started looking for a more suitable alternative.
I really wanted another open source watch, but nothing quite fit the bill: the Bangle.js 2 looks great, but (like the Pine-Time) isn't suitable for swimming (something I used to do regularly and want to get back in the habit of). After evaluating the (sadly quite small) Open Source market, I decided that I'd have to look at more proprietary options.
Ultimately I settled on an Amazfit Bip 3 Pro: it's decently waterproof and has a range of sensors (more than I need really). The Bip U Pro, which is basically a cheaper version of the same watch, was also an early contender until I saw the words "Amazon Alexa Built-in". Nope, not for me, thanks anyway.
An important factor in choosing the Bip was that it appeared that, instead of using the manufacturer's app, I could pair the watch with Gadgetbridge, affording control over the collected data rather than having it sent to some proprietary silo.
In this post, I'll talk about how I built a scheduled job to fetch the health related data that my Bip 3 Pro smartwatch records in order to write it onwards into an InfluxDB database.
Note: If you're not interested in how I got there and just want to know how to run the code for yourself, you can jump down the page.
Gadgetbridge Support
As noted above, the expectation of Gadgetbridge Support was one of the primary motivators in choosing the Bip.
In fact, I got a little overexcited and so, before the watch had even arrived, I'd built a working PoC which
- Fetches a copy of the Gadgetbridge database from Nextcloud (or any other WebDAV endpoint)
- Queries recent data out of the Huami specific tables in that database
- Transforms that data into time-series points
- Writes them into InfluxDB
In theory, once the watch arrived it should just have been a case of pairing it with my phone.
Except, once it turned up, I ran into a problem:
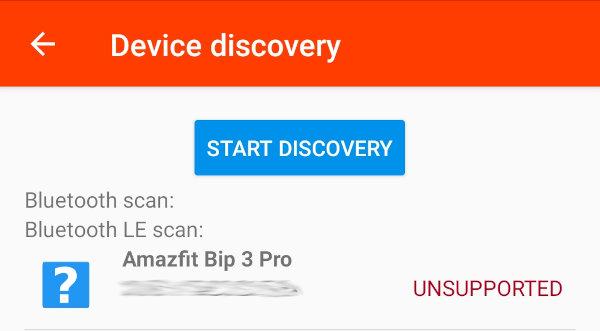
The watch was detected, but was listed as being unsupported.
Searching around, I couldn't find anything specifically about the Bip 3 Pro being supported (or not), but did find several Codeberg issues suggesting that the Xiaomi Mi fit devices (generally the same underlying hardware) seemed to have shifted to using something that was unsupported.
I was... less than happy at this outcome:

Because the device wasn't compatible, I had to throw away a morning's work (actually, I did consider returning the watch for an earlier model, but figured a subsequent firmware update might break it anyway).
If you do have a Gadgetbridge compatible Huami based watch (which includes watches and bands from the Amazfit range as well as Xiaomi's Mi Fit and others) and want to try using my codebase (https://github.com/bentasker/gadgetbridge_to_influxdb), my original ticket provides details of the steps that I followed to configure Gadgetbridge to export into Nextcloud.
UPDATE: Things have changed, and it is now possible to pair a Bip3 with Gadgetbridge - see my change in approach in Collecting data from a Bip 3 Smartwatch with Gadgetbridge, Nextcloud and InfluxDB.
Finding an Alternative Route
Having closed off my Gadgetbridge focused ticket, I raised a new one (MISC-35 for those following along):
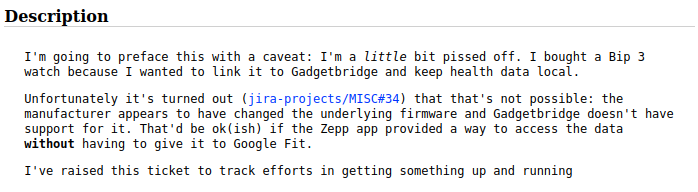
It's perhaps a little understated, but on the rare occasion that I raise a ticket with a caveat like that, it can generally be taken to mean: "I'm going to kick the shit out of this until one of us breaks".
So, it was time to install the official app. The Amazfit smartwatches no longer sync with the Amazfit app, the developer has consolidated it all into a new app called Zepp (also known as com.huami.watch.hmwatchmanager).
Now, in fairness to Zepp, it is not a fully closed ecosystem: it does have support for writing data onwards into Google Fit and various other services. The problem is, they're all services run by people that I don't really want to send this data to (and you probably shouldn't either).
Rather than involving an additional third party service, it was much more desirable, if possible, to extract data directly from Zepp itself.
If my phone were rooted, I could just upload Zepp's databases from internal storage. However, I tend not to root my main phone because various apps check for root and refuse to run (incidentally, the Zepp app also checks for root, though it only currently warns about it).
I did have a quick poke though, so if you are running a rooted device, the sqlite databases live in /data/data/com.huami.watch.hmwatchmanager/databases/ with most of the interesting data being found in companion-aa.db.
Not being able to access these files on a non-rooted phone, I was left with the option of retrieving the data after it had been phoned-home to Zepp's servers.
API Access
Zepp don't seem to have a publicly documented API (although there are some remnants to suggest that they once used to).
After a bit of searching around, I stumbled upon a post by Roland Szabó, detailing how he'd managed to extract records of his workouts from Zepp's API. He even published some example code.
Whilst this didn't fetch any of the information that I was interested in, it did show that some level of extraction was definitely achievable.
More importantly, it provided me with a domain name ( api-mifit-de2.huami.com) to search for to see if anyone else had looked at this, leading me to Hacking the Mi Fit API, which
- provided a working example of going through Zepp's authentication to fetch an authorization token
- Fetched Step counts and sleep data
ben@optimus:~/Downloads$ python3 mifit_api.py --email <redacted> --password <redacted>
Logging in with email <redacted>
Obtained access token
Retrieveing mi band data
2023-08-01
v = 6
Total sleep:  00:00 , deep sleep 00:00 , light sleep 00:00 , slept from 2023-07-31 00:00:00 until 2023-07-31 00:00:00
Total steps:  2234 , used 53 kcals , walked 1587 meters
09:59 - 10:17 725 steps light activity
10:19 - 10:35 860 steps slow walking
10:49 - 10:54 504 steps slow walking
goal = 8000
tz = 0
algv = 2.12.33
sn = <redacted>
byteLength = 8
sync = 1690884430
Although it didn't collect nearly all the data that I wanted, it collected some of it and gave me a suitable base to build upon. I'd have got there in the end, but the headstart was very much appreciated.
Finding other API Endpoints
The existing code called a single API endpoint (/v1/data/band_data.json?query_type=summary). If I wanted to be able to collect more information, I needed to identify some other endpoints.
One way to do this would have been to decompile the Android app. However, because copyright makes it legally problematic, I generally prefer to avoid that if possible. Plus, interpreting the result can turn out to be a lot of work compared to some of the alternatives.
Instead, I decided to man-in-the-middle (MiTM) the app.
This involves having the phone connect via a proxy, (potentially) making the contents of all requests and responses available for inspection. The proxy's CA certificate is first installed on the phone so that the certificates it generates are accepted as valid.
Except... there was a problem.
Prior to Android 7 (I think, maybe it was 8), user installed CA certs were accepted by all apps. After that, though, apps have to opt in (via AndroidManifest.xml). Without this opt-in, only CA certs in the system store are trusted.
The Zepp app hasn't opted in to trusting certs in the user store and so rejected the certificates issued by my MiTM.
Not wanting to mess around too much with my main phone, I flashed and rooted my old Galaxy S4 so that I could use root privileges to copy my CA certificate into the system store (removing the need for an app to opt-in to trusting it):
su
# Verify the certificate is there
ls /data/misc/user/0/cacerts-added/

# Remount the filesystem read/write
mount -oremount,rw /

# Move the cert to system trust
mv /data/misc/user/0/cacerts-added/* /system/etc/security/cacerts

# Reboot the phone
reboot
The certificates issued by my proxy were now trusted by every app on the phone, including Zepp.
With my proxy in the middle, it was then just a case of using the app, observing the resulting requests and responses in order to model out what my script needed to do:

I quite quickly found details of API end points for
Most of which were added to the script.
Heart Rate Data
One of the reasons for moving away from my Watchy was that it didn't have a heart rate sensor, so it was obviously fairly important that this data be extracted. But, the way that the app fetches heart rate data is weird and took me some time to figure out.
The android app provides graphs of historic heart-rate data

But the requests generated to fetch the underlying data are unlike those made for other data categories and, frankly, are a bit odd.
There's a call to /users/<userid>/heartRate, which sounds exactly like what's needed, except that it only ever returns an empty JSON object.
There are also calls to band_data.json but with a different value for the query_type param: /v1/data/band_data.json?query_type=detail.
The responses given by this endpoint take the following form:
{
  "code": 1,
  "message": "success",
  "data": [
    {
      "uid": "<redacted>",
      "data_type": 0,
      "date_time": "2023-08-01",
      "source": 256,
      "summary": "aGVsbG8gd29ybGQ=",
      "uuid": "null",
      "data": "aGVsbG8gd29ybGQ=",
      "data_hr" : "aGVsbG8gd29ybGQ=",
   },
    {
      "uid": "<redacted>",
      "data_type": 0,
      "date_time": "2023-08-02",
      "source": 256,
       "summary": "aGVsbG8gd29ybGQ=",
      "uuid": "null",
      "data": "aGVsbG8gd29ybGQ=",
      "data_hr" : "aGVsbG8gd29ybGQ=",
   },
 ]
}
The attribute summary is a base64 encoded JSON string and contains the step and sleep data that we were already retrieving via the summary query type (thanks to the work of micw).
The attributes data and data_hr, however, are different. When their values are base64 decoded, the result is a binary blob
ben@optimus:~/tmp/zepp$ xxd -ps /tmp/blob2
fefefefefefefefefefefefefefefefefefefefefefefefefefefefefefe
fefefefefefefefefefefefefefefefefefefefefefefefefefefefefefe
fefefefefefefefefefefefefefefefefefefefefefefefefefefefefefe
fefefefefefefefefefefefefefefefefefefefefefefefefefefefefefe
fefefefefefefefefefefefefefefefefefefefefefefefefefefefefefe
fefefefefefefefefefefefefefefefefefefefefefefefefefefefefefe
fefefefefefefefefefefefefefefefefefefefefefefefefefefefefefe
fefefefefefefefefefefefefefefefefefefefefefefefefefefefefefe
fefefefefefefefefefefefefefefefefefefefefefefefefefefefefefe
fefefefefefefefefefefefefefefefefefefefefefefefefefefefefefe
fefefefefefefefefefefefefefefefefefefefefefefefefefefefefefe
fefefefefefefefefefefefefefefefefefefefefefefefefefefefefefe
fefefefefefefefefefefefefefefefefefefefefefefefefefefefefefe
fefefefefefefefefefefefefefefefefefefefefefefefefefefefefefe
fefefefefefefefefefefefefefefefefefefefefefefefefefefefefefe
fefefefefefefefefefefefefefefefefefefefefefefefefefefefefefe
fefefefefefefefefefefefefefefefefefefefefefefefefefefefefefe
fefefefefefefefefefefefefefefefefefefefefefefefefefefefefefe
fefefefefefefefefefefefefefefefefefefefefefefefefefefefefefe
fefefefefefefefefefefefefefefefefeffffffff59ffffffffffffff5c
4c466effffff5e5f5c606b61504cff605eff7775724e5e494c57ff676469
6d64646fff6063ffffffff53ffffffffffffff525b67484b5763ffffffff
5262ff53ffffffffffffff53ffffffffffffffffff4affffffffffffffff
ff43ffffffffffffffffff53ffffffffffffffffff54ffffffffffffffff
ff3cffffffffffffffffff4bffffffffffffffffff4bffffffffffffffff
ff53ffffffffffffffffff52ffffffffff5d61ffff69ffff69ff61ffffff
ff59ffffff5e51ff77ffff5d606c6b6052ffff694969ffffffffffffffff
ff45ffffffffffffffffff6affffff7b46ffffffff435152ffffffffffff
ff78ffffffffffffff48ff70ffff47ffffffffffff49ffffffffff4b3cff
ff69ffffffffffffffffff68ffffffffffffffffff62ffffffff7877ffff
ff48ffffff71ffffffffff63ffffffff71ffffffff69ffffffff6aff8062
5affff44ffff7affffffff6affffffffffffffffff39ffffffffffffffff
ff5bffffffffffffffffff49ffffffffffffffffff63ffffffffffffffff
ff53ffffffffffffffffff62ffffffffffffffffff69ffffffffffffffff
ff60ffffffffffffffffff62ffffffffffffffffff62ffffffffffffffff
ff54ffffffffffffffffff5affffffffffffffffff5bffffffffffffffff
ff52ffffffffffffffffff52ffffffffffffffff595c5c5dff4a6468716e
4d5b65726f4f596465686559606b646a70747a7e7f7f808176797d7a7b79
7b807e7c7871777a5760666f737a7b7a7b7d7e7a7c7d7b7a484effffffff
ff59ffffffffffffffffff53ffffffffffffffffff4bffffffffffffffff
ff59ffffffffffffffffff5affffffffffffff69675affffffffffffffff
ff4bffffff494c6971ffff5affffffffffffffffff5affffffffffffff66
6963ffffffffffffffffff5affffff777548ffffff5f636675ffffffffff
ff62ffffffffffffffffff5affffffffffffffffff62ffffffffffffffff
ff61ffffffffffffffffff5bffffffffffffffffff5cffffffffffffffff
ff5affffffffffffffffff61ffffffffffffffffff62ffff6e484bff7874
ff6affffffffffffffffff4dffffffffff534e524d525854534d56545353
535453585a55534e4c57544e4c51534e514d515253534e4c4b5152584f4c
I figured, almost immediately, that this blob was probably comprised of raw values, but it took me a while to figure out how to extract the right values.
Iterating over each byte and converting it to an int generated an interesting profile, but with values that would probably mean I was in urgent need of a hospital

After a bit of experimentation and staring at it, I had something of a duh moment.
The app is Dalvik (so Java equipped with nipple tassles and handcuffs) and the application hosting the API is probably java too. So, I reasoned, rather than being byte-values, the value was probably wrapped up in some other java-y numeric type.
Approaching it logically:
- A
bytevalue has a maximum value of127. A heart-rate can definitely go higher than that. - The next step up is a
short: it uses 2 bytes per value, with a maximum value of32,767. We certainly shouldn't need a wider range than that to represent a heart-rate.
As an additional positive signal, there were 2880 bytes in the blob, if we divide that by 2, we get the number of minutes in a day (1440).
I kicked together a little script to consume each 2 byte chunk of the bytestring and caste to an integer, before generating line protocol to write onwards into InfluxDB for graphing
#!/usr/bin/env python3

adjusted_vals = []
x = 1
b=b''
with open("/tmp/blob2", "rb") as f:
    while(byte := f.read(1)):
        x += 1
        b += byte
        if x == 2:
            # Reset the counter
            x = 1

            # Convert to an int
            v = int(b.hex(), 16)
            if v < 200:
                adjusted_vals.append(v)
            else:
                # Set an initialisation value
                adjusted_vals.append(9999)

            # Reset the byte string
            b = b''

# Start at midnight, iterate through writing one point
# per minute (skipping initialisation values)
ts = 1691362800
for x in adjusted_vals:
    ts += 60
    if x == 9999:
        continue
    print(f"zeppheartrate,foo=bar hr={x} {ts}000000000")
When viewed in Grafana, the data looked like this:

The profile of the graph is more or less the same as that of the graph in Zepp and none of the values indicate that I might be dead, which can only be taken as a good sign.
So, there you have it: the API exposes heart rate data as a base64 encoded bytestring comprised of 1440 Java shorts, with each short representing a minute of the relevant day.
Some of those values will be 255 or 254 because, by default, the watch is set to collect readings less frequently than that (it looks like it uses 255 as "read not scheduled" and 254 as "failed to read"):
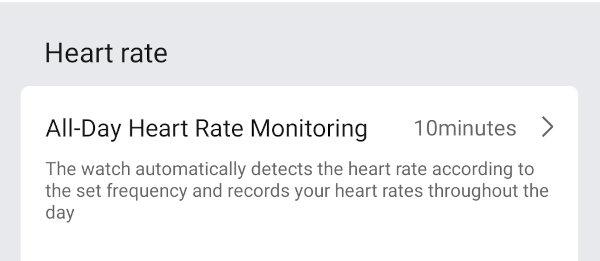
In practice, the frequency of reading is a little more complex than it looks: as described in the gadgetbridge docs the watch will take readings at least once in that interval. If activity is detected, the watch will start taking more frequent readings (though only 1-per-minute will make it into the data_hr attribute).
I haven't yet figured out what the values in the data attribute represent: I'm not currently getting meaningful values back, suggesting that they pertain to something I'm not using (or that, perhaps, the Bip 3 doesn't support).
Scripted Collection
It's still a little messy, but the result of these findings is that I've been able to build a containerised script to fetch health data from Zepp's API and write it onwards into InfluxDB.
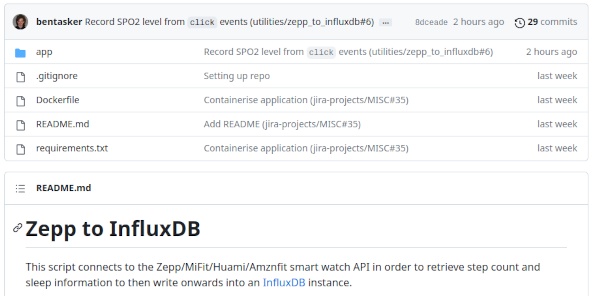
Because its dependencies are quite limited, if desired, the script can also be run without the container
pip install -r requirements.txt
export INFLUXDB_URL=http://127.0.0.1:8086
export INFLUXDB_TOKEN=ffff
export INFLUXDB_ORG=aaaa
export INFLUXDB_BUCKET=health
export ZEPP_EMAIL=mylogin@example.com
export ZEPP_PASS=myP4ss

./app/mifit_to_influxdb.py
Scheduling Runs
The script and its container are designed to be ephemeral, so runs can be scheduled in pretty much whatever way best suits.
For my part, I've scheduled it as a Kubernetes CronJob, using secrets to store the credentials
kubectl create secret generic zepp \
--from-literal='email=someone@example.invalid' \
--from-literal='pass=MyPass'

kubectl create secret generic influxdbv1 \
--from-literal=influxdb_token='ffffaaaaaccccc' \
--from-literal=influxdb_org='abcdef' \
--from-literal=influxdb_url='http://192.168.3.84:8086'
The following YAML defines the job
apiVersion: batch/v1
kind: CronJob
metadata:
  name: zepp-to-influxdb
spec:
  schedule: "50 * * * *"
  jobTemplate:
    spec:
      template:
        spec:
          containers:
          - name: zepp-to-influxdb
            image: bentasker12/zepp_to_influxdb:0.4
            imagePullPolicy: IfNotPresent
            env:

            - name: INFLUXDB_BUCKET
              value: "telegraf"
            - name: INFLUXDB_MEASUREMENT
              value: "zepp"
            - name: QUERY_DURATION
              value: "2"

            - name: INFLUXDB_TOKEN
              valueFrom:
                 secretKeyRef:
                    name: influxdbv1
                    key: influxdb_token
            - name: INFLUXDB_ORG
              valueFrom:
                 secretKeyRef:
                    name: influxdbv1
                    key: influxdb_org
            - name: INFLUXDB_URL
              valueFrom:
                 secretKeyRef:
                    name: influxdbv1
                    key: influxdb_url
            - name: ZEPP_EMAIL
              valueFrom:
                 secretKeyRef:
                    name: zepp
                    key: email
            - name: ZEPP_PASS
              valueFrom:
                 secretKeyRef:
                    name: zepp
                    key: pass

          restartPolicy: OnFailure
Deployment (and any subsequent changes) is just a case of running
kubectl apply -f zepp_cron.yml
Graphing
The script creates quite a few fields (documented here). In fact, the schema could really do with a review and refactor, but I've not seen it as worth the effort because I have a downsampling job which normalises the data into a non-platform specific schema for longer term storage.
Even without that normalisation, though, querying the data is pretty straightforward. For example, we might use the following InfluxQL to query the maximum recorded stress score over time:
SELECT
   max(current_stress_level) as "stress_score"
FROM telegraf.autogen.zepp
WHERE
  $timeFilter
  AND stress='point_in_time'
GROUP BY time($interval)
FILL(null)

It's also possible, just as the app does, to chart out stress level proportions (these charts show different days, left is from Grafana, right is from Zepp):
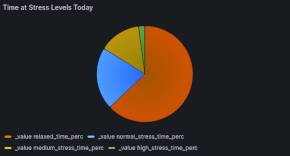
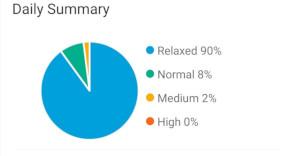
However, these charts are a very good example of why it's so important that data not be locked away.
They're not actually all that informative on a day-to-day basis because the calculations include sleeping hours and so (outside of those awful periods that we're all painfully familiar with), relaxed will almost always be the biggest proportion, potentially masking an ongoing daytime issue.
The *_time_perc fields that the chart relies on are calculated (by the app) once daily, so we can't simply remove sleeping hours to get a more representative view.
However, by using Flux we can implement a query which uses the point-in-time stress measurements to calculate a level and exclude sleeping hours
import "date"

from(bucket: "health")
  |> range(start: v.timeRangeStart, stop: v.timeRangeStop)
  |> filter(fn: (r) => r["_measurement"] == "zepp")
  |> filter(fn: (r) => r["_field"] == "current_stress_level")
  |> filter(fn: (r) => r["stress"] == "point_in_time")

  // Exclude sleeping hours
  |> filter(fn: (r) => not contains(value: date.hour(t: r._time),
                       set: [0,1,2,3,4,5,6]))
  // Skip missed reads
  |> filter(fn: (r) => r._value > 0)

  // Turn the reads into thresholds and counts
  // the thresholds used come from the description
  // in the apps UI
  |> map(fn: (r) => ({
    _time: r._time,
    _value: 1,
    _field: if r._value <= 39
               then "relaxed"
               else if r._value >= 40 and r._value <= 59
                    then "normal"
                    else if r._value >= 60 and r._value <= 79
                         then "medium"
                         else if r._value > 80
                              then "high"
                              else "unknown"

  }))
  // Sum the values so we can get the relative proportions
  |> sum()
  |> keep(columns: ["_field", "_value"])
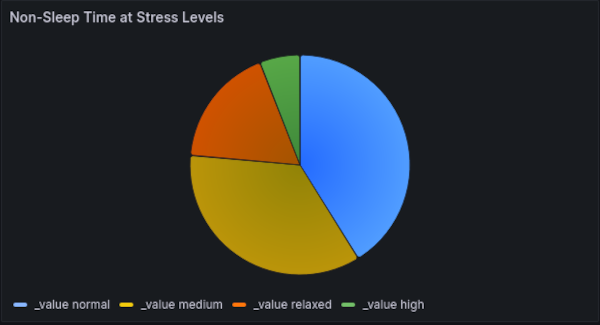
We now have a view of stress levels during daytime(ish) hours that can be used to help judge whether some sort of lifestyle changes might be needed.
If we wanted to be really posh, we could actually have the query join() in the realtime sleep tracker (current_sleep_state) in order to exclude actual sleeping hours rather than presumed sleeping hours. It might even be that I add that calculation to the collection script in future, so that we can expose dedicated fields.
We can also chart daily step counts and the approximate distance covered
SELECT
   max("total_steps") AS "steps",
   max("distance_m") AS "distance"
FROM "telegraf"."autogen"."zepp"
WHERE
   $timeFilter
   AND "activity_type"='steps'
GROUP BY time(1d) FILL(null)

Note: the last time that I showed my step-count graph, I felt the need to explain why I kept missing the 10,000 step target. Happily, though, the news has broken that a 10,000/day step-count is much more than needed, and anything more than 2,300 brings benefit, so: yay me!
Having solved the puzzle of the binary blob (well, one of them), we can also chart heart rate information.
Unfortunately, the Zepp app only records resting heart rate once a day, meaning that we're unable to graph that with much granularity. However, we can still include it as a signal and the easiest way to do this is to configure the Grafana cell with two queries
Resting rate:
SELECT
    mean("heart_rate") AS "resting"
FROM "telegraf"."autogen"."zepp"
WHERE
    $timeFilter
    AND "hr_state"='resting'
GROUP BY time($interval)
FILL(previous)
Heart rate:
SELECT
    mean("heart_rate") AS "mean_heart_rate"
FROM "telegraf"."autogen"."zepp"
WHERE
    $timeFilter
    AND "hr_measure"='periodic'
GROUP BY time($interval)
FILL(null)
This results in a chart like the following
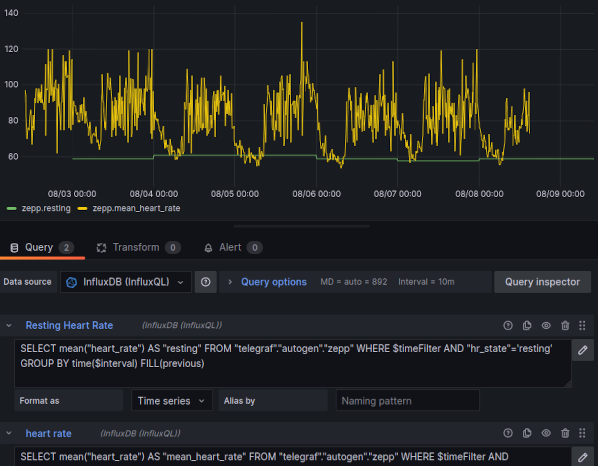
The script writes a lot of information into the zepp measurement, so the range of dashboards that I create will very likely grow over time, particularly as my understanding of Zepp's API and the data that it provides evolves.
Data Update Frequency
Despite being almost constantly connected (in order to send notifications to the watch), the Zepp app doesn't seem to sync data very frequently. In fact, as far as I can make out, it often doesn't sync data at all until the app is next opened (I haven't yet tried leaving it for days though).
So, although data can be extracted from the API, it's currently not much use for real-time monitoring & alerting. I do plan to work on mitigating this in future, I'm hoping that I can use Tasker to periodically send an intent to Zepp to have it sync (or, if there's no such intent, to open, which should trigger a sync).
On the flip-side, of course, this delay in syncing is also a good sign that Zepp (probably) aren't collecting real-time data either.
Conclusion
There's nothing inherently wrong with the functionality of the Zepp app, in fact, it does what it does quite well. The problem for me, is that it's a data-silo and I really don't like those. If a wall is put between me and my data, I do tend to feel a bit of an urge to kick it in, to the extent that I'm not actually entirely certain that I haven't gone through all this simply out of principle.
I thought the solution was going to be simple and subsequently finding that I wasn't able to go the gadgetbridge route was quite frustrating (though, of course, no fault of the Gadgetbridge folks).
Although I've found a way to extract data, it relies on use of the official app, meaning that data continue to be sent into the cloud service of an organisation who may, or may not, do a good job of protecting it.
Even if they do protect it well, the health data that they hold gets aggregated and analysed: not only does the app currently make API calls to fetch globalised averages of some metrics, the company also makes data available to researchers.
Whilst health research is very important, the idea of a foreign commercial company acting as a data-broker does make me a little uncomfortable: they're not subject to the same weight of responsibility and regulation that a healthcare provider is, they don't have the benefit of an existing trust relationship and (if they do screw up) it'd likely be very difficult to obtain meaningful legal remedy.
It's worth noting too, that the watch has GPS, and even professional secret keepers have been caught out as the result of provider mistakes when handling location data.
Needless to say, I'd prefer my data didn't need to be sent to Zepp's servers in the first place and if/when someone manages to add Bip 3 support to Gadgetbridge, it's very likely that I'll pivot back to my original approach.
Similarly, if the Bip were to need replacing before then, my replacement would almost certainly be something that I've confirmed to be fully supported by gadgetbridge.
Until then, though, it's taken a bit of work, but I've now got a script which can periodically fetch data via Zepp's API for local querying, graphing and storage.
Grafana dashboards definitely lack the "shiny" feel that the Zepp app boasts, but the important thing is that the underlying data is in my possession, allowing me to do things that aren't possible via the app (whether that's eventually configuring alerts to better encourage exercise and breaks, or dropping sleeping hours from the stress proportions analysis to get a better idea of whether day-to-day changes are required).
With my approach being based on reverse engineering, it is quite possible that the API will change over time, breaking my data collection in the process. However, the risk of that happening suddenly should be quite low, as there are a wide range of devices and brands (Amazfit, Mi Fit, Huami etc etc) using apps which appear to rely on that same functionality.
For now though, I've got access to the metrics that I wanted (and some extra), so can start playing around with making use of them.