Linking my Watchy Open Source Watch to InfluxDB
A few weeks ago, RevK posted on Mastodon about his newly arrived Watchy - an opensource e-ink based wristwatch.
There I was, minding my own business, and then... nerd-sniped by a toot.
There are a number of Open Source watches on the market, but the Watchy is one of very few with Wifi support. That, combined with the battery life that the e-ink display makes possible, made the Watchy stand out: having external connectivity available enables a range of tinkering possibilities.
It's true that it's perhaps not as pretty as the PineTime or the Bangle.js, but their lack of direct external connectivity means that neither currently hold quite the same "oh, I could build X" appeal for me.
By default, the Watchy periodically polls the OpenWeatherMap API to fetch temperature and local weather information. What I wanted to do, was have the Watchy also connect to an InfluxDB instance so that it could fetch additional information as well as writing some watch-originated stats out for dashboarding elsewhere.
In this post, I'll talk about how I connected my Watchy up to InfluxDB so that it can both read and write metrics. The approach that I used should be valid on anything Arduino-ish, and a full copy of the code referred to can be found in my article scripts repo.
Watch Specs
It probably makes sense to start with an introduction to Watchy itself.
Watchy is made by Squarofumi and one of its key selling points is that it is Arduino compatible.
Both the software and the hardware are open source (Software / Hardware) and it's possible to change the way that the display looks by creating WatchFaces, leading to some pretty cool options being available


There's also a gallery of case schematics for those with access to 3D printers.
The watch rocks a ESP32-PICO-D4 microcontroller, bringing with it the following
- WiFi (802.11 b/g/n)
- Bluetooth (v4.2 BR and LE)
- 8KB RTC FAST memory
- 8KB RTC SLOW memory
- 520KB SRAM
- 4MB Flash memory
The watch has an a 1.5" e-paper display (turns out "e-ink" is a brand name) with a 200x200 resolution.
Mounted on the board are four buttons, the real-time-clock and a vibration motor:

For those who want to geek out further on the hardware, full schematics and a BoM can be found in the Watchy Docs.
All in all, the watch has a lot of potential and I was pretty excited to receive and start playing around with it.
Unfortunately, my first delivery turned up with a broken menu button (which is why the bottom left button lacks a toggle in the picture above). A replacement watch was quickly shipped and I was told I could keep (or scrap) the broken one, so I unexpectedly ended up with a staging environment.
Writing Stats
Although not exactly over-burdened with sensors, Watchy does have an accelerometer, which the core code uses as a stepcounter. Step counts are exactly the kind of information we'd expect a wearable to write into an external database.
The other thing that I wanted to track was battery level, so that I could create an alert reminding me to charge it when it's getting low.
Watchy faces are written in C++ and can easily be flashed onto the device using the Arduino IDE, so rather than crafting HTTP requests myself, I was able to import and use the ESP8266 InfluxDB client library to write stats into InfluxDB:
#include <InfluxDbClient.h>

#define INFLUXDB_URL "http://192.168.3.84:8086"
#define INFLUXDB_DB_NAME "testing_db"

// Instantiate the client
InfluxDBClient client(INFLUXDB_URL, INFLUXDB_DB_NAME);

// Instantiate a point
Point wsensor("watchy");

// .. snip ..

// Collect and write stats into InfluxDB
void Watchy7SEG::writeStats(){
  // Clear any existing fields
  wsensor.clearFields();

  // Get the processor's MAC address
  // and build a unique device identifier
  uint64_t chipid;
  chipid = ESP.getEfuseMac();
  String device_id = String("watchy-") + String(chipid);

  // Get stepcount and batter voltage
  uint32_t stepCount = sensor.getCounter();
  float vbat = getBatteryVoltage();

  // Set fields and tags
  wsensor.addField("steps", stepCount);
  wsensor.addField("batteryvoltage", vbat);
  wsensor.addTag("device", device_id);

  // Write the point to the buffer
  client.writePoint(wsensor);

  // Ensure the buffer is flushed
  if (!client.isBufferEmpty()) {
      // Write all remaining points to db
      client.flushBuffer();
  }
}
The InfluxDB Arduino client library handles everything under the hood, sending line protocol to the InfluxDB instance defined in INFLUXDB_URL. I tested against a local instance, but writes into InfluxDB Cloud also work just fine.
Triggering the writes is simple: Whenever the watch display needs to refresh, a function called drawWatchFace() is invoked (custom watch faces are created by overriding that method), so, to trigger the stats write, I just needed to insert a call to writeStats() into that method. We'll look at that in a little more depth later in the post, though.
Reading Stats
We recently had Solar installed so, at the moment, I am all about monitoring our Solar Generation stats.
Initially, I intended to retrieve the Solar's battery status (Charging, Discharging, Idle) but it ultimately didn't feel like a good use of the limited screen space. Instead, I decided a more interesting metric to display was what percentage of our power consumption was supplied locally (i.e. direct from the panels or via battery).
My Soliscloud Telegraf Plugin calculates and exposes a field (localSupplyPercToday) which can be used for this instead of performing local calculations at the expense of the watch's battery.
Although the Arduino InfluxDB client supports querying with Flux, I wanted to experiment with building HTTP requests using the ESP32 HTTP Client .
Unfortunately, the HTTP Client doesn't currently support the setting of custom Authorization headers, so it's not currently possible to send an authenticated flux query. Instead, I opted to send InfluxQL queries directly (this is possible because InfluxQL uses basic authentication rather than tokens).
The query itself is quite simple:
SELECT
    round(last(localSupplyPercToday::integer)) as i
FROM solar_inverter
WHERE time > now() - 20m
It selects the metric written most recently (and within the last 20 minutes) before rounding it. The round and caste are there to avoid getting a float back (the watch doesn't really have screenspace to waste by displaying decimals).
In C++ the first bit of that process looks something like this
#include <HTTPClient.h>

#define INFLUXDB_READ_AUTH_HEADER ""
#define INFLUXDB_READ_URL "http://192.168.3.84:8086"
#define INFLUXDB_READ_DB "Systemstats"

void Watchy7SEG::getSolarState(bool fetchState){
  bool haveValue = false;
  String suppliedString;


  if (fetchState){
      HTTPClient http;
      // 3 second max timeout, no point burning battery
      http.setConnectTimeout(3000);

      // Add the auth header
      // underlying http library requires user/pass
      // so we can't set a Bearer header
      // TODO: Move username to a constant
      http.setAuthorization("any", INFLUXDB_READ_AUTH_HEADER);

      // Define the query
      // the library doesn't urlencode for us, so we need to supply pre-encoded query strings
      String query = "&q=SELECT%20round%28last%28localSupplyPercToday%3A%3Ainteger%29%29%20as%20i%20FROM%20solar_inverter%20WHERE%20time%20%3E%20now%28%29%20-%2020m"
      //  build the url
      String QueryURL = INFLUXDB_READ_URL + String("/query?db=") + INFLUXDB_READ_DB + query;

      // Place the request
      http.begin(QueryURL.c_str());
      int httpResponseCode = http.GET();
This places a HTTP request against the InfluxDB instance, running our query.
If the query is successful, InfluxDB will return a response that looks something like the following
{
      "results":[
        {
            "statement_id":0,"series":[{
                "name":"solar_inverter",
                "columns":["time","i"],
                "values":[
                      ["2023-06-17T10:11:01Z",77]
                   ]
                }
            ]
        }
    ]
}
The code then checks that the request was successful, decodes the JSON and extracts the value:
if (httpResponseCode == 200) {
        String payload             = http.getString();
        JSONVar responseObject     = JSON.parse(payload);

        // This needs a double caste - JSONVar can't go straight to string if the json
        // entry wasn't itself a string
        uint32_t supplyPerc = responseObject["results"][0]["series"][0]["values"][0][1];
        suppliedString = String(supplyPerc);
}
Displaying the Metric
Retrieving metrics is one thing, it's quite another to display them in a meaningful manner.
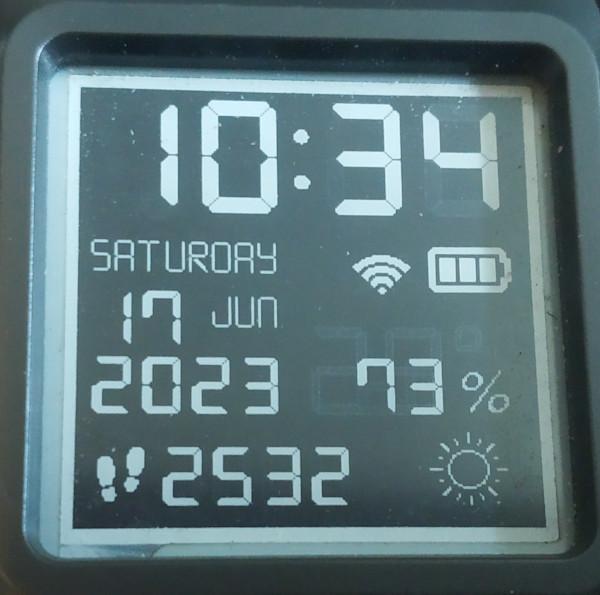
The first challenge is to find some screen space to use, because the default watch face (7_SEG) is quite densely packed:

There really isn't any spare space left to work with. There was nothing I felt comfortable losing, so rather than sacrificing something to make space, I decided to have part of the layout alternate at each refresh.
The temperature indicator seemed best suited to this, so I decided to implement the following scheme
- If
$minuteis odd, display Temperature - If
$minuteis even, display Solar Efficiency
This alternation was implemented by updating the signature of the Watchface's existing drawWeather() function so that it accepts a boolean as an argument, before adding a truthiness check within the function itself
void Watchy7SEG::drawWeather(bool suppressTemp){

    weatherData currentWeather = getWeatherData();
    int16_t weatherConditionCode = currentWeather.weatherConditionCode;

    // Should we display temperature?
    if (!suppressTemp){
        int8_t temperature = currentWeather.temperature;

        display.setFont(&DSEG7_Classic_Regular_39);
        int16_t  x1, y1;
        uint16_t w, h;
        display.getTextBounds(String(temperature), 0, 0, &x1, &y1, &w, &h);
        if(159 - w - x1 > 87){
            display.setCursor(159 - w - x1, 150);
        }else{
            display.setFont(&DSEG7_Classic_Bold_25);
            display.getTextBounds(String(temperature), 0, 0, &x1, &y1, &w, &h);
            display.setCursor(159 - w - x1, 136);
        }
        display.println(temperature);
        display.drawBitmap(165, 110, currentWeather.isMetric ? celsius : fahrenheit, 26, 20, DARKMODE ? GxEPD_WHITE : GxEPD_BLACK);
    }
I then updated drawWatchFace() to check whether the current minute is even and pass the boolean accordingly
bool minute_is_even = (currentTime.Minute % 2 == 0);
// ..snip..

drawWeather(minute_is_even);
// ..snip..

if (minute_is_even){
    getSolarState(false);
}
If minute_is_even is true, then drawWeather doesn't write out the current temperature, leaving screen space for our solar metric to be output by getSolarState()
    suppliedString = String(supplyPerc);

    // Display the value
    // The text will be right aligned, so work out where to start writing it
    int16_t  x1, y1;
    uint16_t w, h;
    display.getTextBounds(suppliedString, 0, 0, &x1, &y1, &w, &h);
    display.setCursor(159 - w - x1, 150);

    // Print the value
    display.println(suppliedString);
This causes the watch to display a value (in our example JSON above, 77), but printing a number on it's own doesn't look great - at the very least it needs a unit.
In an ideal world, you'd be able to add the unit by concatenating it onto the end (i.e. suppliedString + String("%")), but display.println() doesn't appear to support punctuation: the watch just displays an empty box instead.
Instead, to display a percent symbol, I created a bitmap of the character:
- Lanch GIMP
- Create a new
20x26project with a black background (the size was based on other bitmaps in the watchface) - Add a text box with a
%in - Set the font colour to white
- Adjust the font size until the percent filled the space
This resulted in the following bitmap

Which I then passed into image2cpp (choosing transparent background), converting it into a bytearray that could be fed into the code
const unsigned char percent [] PROGMEM = {
    0x00, 0x00, 0x20, 0x00, 0x07, 0x80, 0x20, 0x00, 0x08, 0xc0, 0x40, 0x00, 0x10, 0x60, 0x80, 0x00,
    0x20, 0x61, 0x00, 0x00, 0x20, 0x61, 0x00, 0x00, 0x20, 0x42, 0x00, 0x00, 0x30, 0x84, 0x00, 0x00,
    0x1f, 0x08, 0x00, 0x00, 0x00, 0x08, 0x00, 0x00, 0x00, 0x10, 0x00, 0x00, 0x00, 0x20, 0xf8, 0x00,
    0x00, 0x43, 0x0c, 0x00, 0x00, 0x42, 0x0c, 0x00, 0x00, 0x86, 0x04, 0x00, 0x01, 0x04, 0x0c, 0x00,
    0x02, 0x06, 0x08, 0x00, 0x06, 0x07, 0x30, 0x00, 0x04, 0x03, 0xe0, 0x00, 0x00, 0x00, 0x00, 0x00
};
I added this to icons.h.
With the bitmap available, it was just a case of adding a line after the value is printed
   // Print the value
   display.println(suppliedString);

   // Draw a percent symbol
   display.drawBitmap(165, 130, percent, 26, 20, DARKMODE ? GxEPD_WHITE : GxEPD_BLACK);
With all that done, every 2 minutes, the Watchy displays our self sufficiency percentage:
Power Saving
Like most wristwatches, the Watchy only has a small battery (in this case, a 200 mAh lithium polymer one).
As you can probably imagine, connecting to wifi and making HTTP requests every minute is not exactly battery friendly. So, although my initial implementation was working, battery life was now dire with the watch going from a full charge to empty in about 6 hours.
Clearly, I needed to reduce the frequency of requests (I also did a little refactoring at the same time to remove any duplication of processing).
Writing into InfluxDB less frequently looked like a comparatively simple task - after all there's nothing user visible to worry about, so it would just have been a case of gating the function with a time-related conditional
void Watchy7SEG::writeStats(){
  // Write every 5 mins
  if (currentTime.Minute % 5 == 0){
      // Clear any existing fields
      wsensor.clearFields();

    // .. etc
However, the read of solar efficiency stats was a different matter.
The code, as written, was querying and displaying the result. If I simply gated the function with a time based check, there would be prolonged periods where that section displayed nothing. Moving to only displaying stats once every 5 minutes didn't feel like an acceptable solution.
The only feasible answer was to introduce a cache to allow displaying to continue at the same frequency, whilst querying could be moved to only happening periodically.
Normally, one way of implementing this would be to define a global and copy the value into that:
uint32_t localEfficiency=0;

void Watchy7SEG::getSolarState(bool fetchState){
  // .. snip
  if (fetchState){
      // Fetch the value
      // .. snip
      uint32_t supplyPerc = responseObject["results"][0]["series"][0]["values"][0][1];

     // Copy into the cache
     localEfficiency = supplyPerc;
  }else{
    // Just fetch the value from cache
    supplyPerc = localEfficiency;
  }
}
However, in this case, such an approach won't work without change.
To conserve energy, Watchy puts the ESP32 into deep sleep between screen refreshes. Deep sleep powers off most of the hardware, so when the system wakes for the next screen refresh, localEfficiency will be uninitialised again.
It is, however, possible to have a variable's state survive deep sleep.
Using the RTC_NOINIT_ATTR attribute macro means that the variable is put into RTC Slow Memory. It's still volatile memory, but it remains powered during deep sleep, ensuring that stored values remain available when the device wakes.
The following code introduces a (very) simple cache that'll survive deep sleep
// We want the last cached value to be kept in the RTC's memory
// otherwise it won't survive sleeps
RTC_NOINIT_ATTR uint16_t lastEfficiency=0;

void Watchy7SEG::getSolarState(bool fetchState){
  // .. snip
  if (fetchState){
      // Fetch the value
      // .. snip
      uint16_t supplyPerc = responseObject["results"][0]["series"][0]["values"][0][1];

     // Copy into the cache
     localEfficiency = supplyPerc;
  }else{
    // Just fetch the value from cache
    supplyPerc = localEfficiency;
  }
}
The watch only has 8KB of RTC Slow memory available (some of which will already be spoken for). So, in order to avoid wasting such a limited resource, the code stores an unsigned 16 bit integer rather than the string representation that we later create. We could actually get away with uint8_t but it makes checking for uninitialised values a little harder.
With the means to cache results between runs added, I was able to reduce the frequency at which solar efficiency stats were retrieved to 30 minutes
void Watchy7SEG::drawWatchFace(){

    bool minute_is_even = (currentTime.Minute % 2 == 0);
    // .. snip

    drawWeather(minute_is_even);
    // .. snip

    // Only trigger network request related stuff every
    // 30 mins
    if ((currentTime.Minute == 0 || currentTime.Minute == 30) && connectWiFi()) {
        // Trigger solar state update
        if (minute_is_even){
          getSolarState(true);
        }

        // Push stats to InfluxDB
        writeStats();

        // Turn the radios back off
        WiFi.mode(WIFI_OFF);
        btStop();
    } else {
        if (minute_is_even){
          getSolarState(false);
        }
    }
}
I chose 30 minutes because that's how regularly Watchy polls weather data. I included the call to writeStats() in the same conditional to keep things consistent (and, realistically, it's unlikely I need a granularity of <30 minutes on a step counter).
Because I had a local cache available, I was also able to add some basic error handling to the HTTP request - if it fails, the watch falls back onto a cached value (if one is available):
void Watchy7SEG::getSolarState(bool fetchState){
  bool haveValue = false;
  String suppliedString;

  // To save battery, we only actually place a HTTP request every
  // so often and use a cached version the rest of the time
  if (fetchState){
      HTTPClient http;

      // 3 second max timeout, no point burning battery
      http.setConnectTimeout(3000);

      // Add the auth header (underlying http library requires user/pass)
      // so we can't set a Bearer header
      // TODO: move user to a constant
      http.setAuthorization("any", INFLUXDB_READ_AUTH_HEADER);

      // the library doesn't urlencode for us, so we need
      // to supply pre-encoded query strings
      String QueryURL = INFLUXDB_READ_URL + String("/query?db=") + INFLUXDB_READ_DB + String("&q=SELECT%20round%28last%28localSupplyPercToday%3A%3Ainteger%29%29%20as%20i%20FROM%20solar_inverter%20WHERE%20time%20%3E%20now%28%29%20-%2020m");

      // Place the request
      http.begin(QueryURL.c_str());
      int httpResponseCode = http.GET();

      // Was the request successful?
      if (httpResponseCode == 200) {
        String payload             = http.getString();
        JSONVar responseObject     = JSON.parse(payload);

        // This needs a double caste
        // JSONVar can't go straight to string if the json
        // entry wasn't itself a string
        uint16_t supplyPerc = responseObject["results"][0]["series"][0]["values"][0][1];
        suppliedString = String(supplyPerc);

        // Cache the value
        lastEfficiency = supplyPerc;
        haveValue = true;

      } else if (lastEfficiency < 1000){
          // Request failed so use the cached version
          suppliedString = String(lastEfficiency);
          haveValue = true;
      }
      // Close the HTTP object
      http.end();
  } else {
    // Using cached version, if available
    if (lastEfficiency < 1000){
          suppliedString = String(lastEfficiency);
          haveValue = true;
    }
  }
  // If we have a value, display it
  if (haveValue){
    // The text will be right aligned, so work out where to start writing it
    int16_t  x1, y1;
    uint16_t w, h;
    display.getTextBounds(suppliedString, 0, 0, &x1, &y1, &w, &h);
    display.setCursor(159 - w - x1, 150);

    // Print the value
    display.println(suppliedString);

    // Draw a percent symbol
    display.drawBitmap(165, 130, percent, 26, 20, DARKMODE ? GxEPD_WHITE : GxEPD_BLACK);
  }
}
The code checks if (lastEfficiency < 1000) because the initialisation values for the variable are very high and we don't want to print anything that we haven't deliberately stored.
As a result of the changes, battery life improved enormously, with the watch now able to last days on a single charge.
One small problem with the code though: if the watch fully restarts (whether because of pushing code to it, or the battery being disconnected), it can take up to 30 minutes for solar efficiency data to start being displayed. I did consider implementing something to handle this, but decided the (very rare) inconvenience didn't outweigh the potential ongoing battery cost of the mitigations.
Summary
So, to summarise: after a (relatively small) amount of code monkeying, my Watchy now
- Displays the current temperature on odd minutes
- Displays a Solar efficiency percentage on even minutes
- Writes step counter and battery voltage values to InfluxDB every 30 minutes
- Fetches updated solar efficiency data from InfluxDB every 30 minutes
Monitoring Step Counts
It wouldn't really be a blog post about metrics without at least one graph...
Now that my Watchy is pushing step counter readings periodically, it's possible to create a Grafana dashboard showing the number of steps per day:
SELECT
   max("steps") AS "steps"
FROM "testing_db"."autogen"."watchy"
WHERE $timeFilter AND "device"='${watchy}'
GROUP BY time(1d) FILL(null)
Giving the following chart
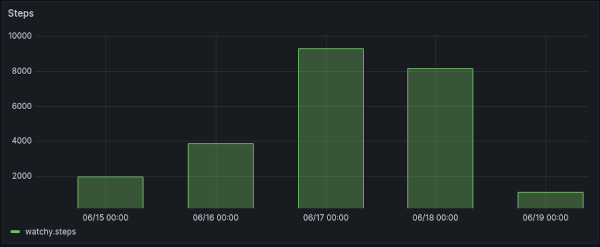
The watch goes through a hard reset (which resets the step counter) when new firmware is loaded, so my experimenting resulted in lower readings in the first couple of days - I have no such excuse over the last few days.
Battery Level Alerting
Battery voltage information going into InfluxDB makes it possible to have a reminder email sent when the battery is getting low, it's basically just a case of working out the values to alert on.
The 7_SEG Watchface includes a battery level indicator.

The codebase that generates this helpfully tells us how voltages compare to battery charge level:
    int8_t batteryLevel = 0;
    float VBAT = getBatteryVoltage();
    if(VBAT > 4.1){
        batteryLevel = 3;
    }
    else if(VBAT > 3.95 && VBAT <= 4.1){
        batteryLevel = 2;
    }
    else if(VBAT > 3.80 && VBAT <= 3.95){
        batteryLevel = 1;
    }
    else if(VBAT <= 3.80){
        batteryLevel = 0;
    }

    for(int8_t batterySegments = 0; batterySegments < batteryLevel; batterySegments++){
        display.fillRect(159 + (batterySegments * BATTERY_SEGMENT_SPACING), 78, BATTERY_SEGMENT_WIDTH, BATTERY_SEGMENT_HEIGHT, DARKMODE ? GxEPD_WHITE : GxEPD_BLACK);
    }
The variable batteryLevel defines how many blocks/currents are filled within the battery icon.
The code shows that, between 3.8v and 3.95v, the battery indicator will display one filled block. It makes most sense (IMO) to fire an alert a little before that final block is due to disappear.
However, we also need to consider a handful of scenarios that might lead to flapping alerts:
- Temporary dip in voltage (as a result of change in temperature, or some other factor)
- Watch falling off WiFi and not reporting in
To cater for the first, we aggregate over 2 writes:
SELECT
   mean("batteryvoltage") AS "mean_batteryvoltage"
FROM "testing_db"."autogen"."watchy"
WHERE $timeFilter
GROUP BY time(1h), "device" FILL(previous)
This means that the average voltage reported by two consecutive writes needs to be below the alerting threshold.
We select data across a period of a few hours and use fill(previous) so that, if we've had a write in that time, the watch not subsequently reporting in won't trigger alerts (because that would be quite annoying if I've gone out for the day).
The Grafana alert then applies last to select the final grouping and compares it to a threshold (3.85):

If the last 1 hour averages below 3.85v an alert will fire.
However, alert emails might still be sent if I were away from WiFi for a more extended period (leading to a >3h gap in data), so the alert is also configured to treat a lack of data as OK:

This helps to ensure that alerts won't be sent unnecessarily, but does also mean that an alert won't be sent if the watch ever stops reporting in (though a separate alert for that could easily be added).
Conclusion
It's not the end of my tinkering, but my Watchy is now connected up to InfluxDB and able to both read and write metrics, with alerts sent to me via email if the battery gets too low.
Currently on my list of potential future changes is
- Have Telegraf make the OpenWeatherMap calls and write the results into Influx (turns out there's already a plugin). This would allow the watch to fetch from InfluxDB instead and (hopefully) reduce local processing costs (it'd also mean I could use the weather data in other projects)
- Use readings from my weather station rather than the OpenWeatherMap calls - giving a reading from my garden rather than forecast expectations for the town
- Take readings from the inbuilt temperature sensor (I hadn't actually realise it had one, until I saw a reference to it in Watchy's source code ) and write into InfluxDB
- Potentially capture temperature/steps more regularly and cache in RTC SLOW Memory, writing multiple points to InfluxDB every 30 minutes
- Build some basic alarm functionality
I'd also like to play around with setting up alerts to send motivational (or de-motivational) emails based on the previous day's step count.
Overall, I'm generally pretty pleased - it's not often that I impulse buy a gadget and have it live up to expectations, but Watchy seems to have managed to do exactly that.