Connecting my Glow Smart Meter Display to InfluxDB and HomeAssistant
We recently (and slightly begrudingly) had a smart meter installed: it's more or less a requirement if we want to receive payment for energy exported from our solar install (or, at least, it is if we want any kind of sensible rate per unit).
Unsurprisingly, the IHD that EDF supplied (a Geo Trio) was little more than e-waste (to be fair, they're not alone: research found that IHDs have little impact on people's energy usage habits) and soon found it's way to the electrical recycling bin (actually, really, I was quite good - the temptation to try and serial into it to mess around with the meter hub's Zigbee network really was quite strong).
I go a little bit further than most when it comes to monitoring our electrical usage, so with a smart meter now collecting and submitting readings periodically, I wanted to move to using these instead of those collected by my previous solution (an Own Intuition clamp meter).
Unfortunately, unlike some other suppliers, EDF doesn't appear to make readings available via API. In fact, despite the meter submitting readings every 20 minutes (UPDATE: apparently it doesn't submit them, it stores them locally and then the supplier retrieves the last 48hrs once a night), it can take days for details to appear in their "energy hub" web-portal (for example, whilst proof reading this on 2 Jul, the most recent hourly stats in EDF's hub are from 29 June!).
I find this.... disappointing, to say the least. The provider has gained the ability to effectively remotely disconnect us (even if by accident) and can't even provide the means to pull usage metrics in a timely manner? GTFO.
A Solution
Thankfully, I remembered reading (somewhere) about an after-market IHD which had the ability to write usage metrics out to a MQTT broker - a quick search found the Hildebrand Glow IHD. This promised to give near real-time reading, much like those I already have via Owl Intuition.
This post details the process that I followed to
- Stand up a Mosquitto MQTT Broker for Glow to write into
- Configure Telegraf to subscribe to the MQTT topics and write into InfluxDB
- Create a Grafana dashboard to visualise the stats
- Have HomeAssistant also fetch the stats for use in automations
Because of strict rules on what can and can't be connected to a smart meter, it is necessary to create a (free) account before ordering the Glow. The account is easiest to create via the Bright App.
Running Mosquitto
The Glow display needs a MQTT broker to write to (actually, it looks like Hildebrand may also host one, but I prefer local comms where possible).
I didn't previously have a MQTT broker running, so decided to run an instance of Mosquitto in Docker.
The first step was to create a couple of local directories to use for persistent data and config.
mkdir docker_files/mosquitto/config -p
mkdir docker_files/mosquitto/data
Next was building a configuration file
cat << EOM > docker_files/mosquitto/config/mosquitto.conf
# Where to listen
listener 1883 0.0.0.0

# This will be changed after first run
allow_anonymous true

# Periodically save the queue to disk
# this allows it to survive restarts
#
# Probably overkill for this, but helpful if
# I start sending other stuff via the broker
persistence true
persistence_location /mosquitto/data/

# Write logs to stdout so that docker can catch them
log_dest stdout
EOM
Starting the container for the first time:
docker run -it -d \
--restart=always \
--name=mosquitto \
-h mosquitto \
-p 1883:1883 -p 9001:9001 \
-v $PWD/docker_files/mosquitto/config:/mosquitto/config \
-v $PWD/docker_files/mosquitto/data:/mosquitto/data \
eclipse-mosquitto
Technically, that could have been enough on it's own.
However, Mosquitto was configured not to require authentication and it's never a good idea to leave unauthenticated apps lying around (ideally, I'd also want TLS, but the Glow doesn't support it).
So, I invoked mosquitto_passwd to create a user
docker exec -it mosquitto mosquitto_passwd -c /mosquitto/config/passwordfile admin
Then rewrote the configuration file to enable authentication
docker stop mosquitto
cat << EOM > docker_files/mosquitto/config/mosquitto.conf
listener 1883 0.0.0.0

# Require a valid user
allow_anonymous false
password_file /mosquitto/config/passwordfile

persistence true
persistence_location /mosquitto/data/
log_dest stdout
EOM
Restarting the container put the change into effect
docker restart mosquitto
I then tested to ensure that auth was actually being enforced.
First, I created a subscription to a test topic (remember to replace your password if you're following along)
docker exec -it mosquitto \
mosquitto_sub -h 127.0.0.1 -t /hello/world -p 1883 -P <password> -u admin
In a second terminal I published into the topic
docker exec -it mosquitto \
mosquitto_pub -h 127.0.0.1 -t /hello/world -p 1883 -P <password> -u admin -m 'Hello World!'
The message Hello World! appeared in the first terminal.
To check that auth was actually being enforced, I tried to subscribe without providing credentials
docker exec -it mosquitto \
mosquitto_sub -h 127.0.0.1 -t /hello/world -p 1883
Which resulted in
Connection error: Connection Refused: not authorised.
I didn't really want the IHD and Telegraf using a user called admin though, so added a second user (note the lack of -c flag in this command, we want to update rather than overwrite the password file)
docker exec -it mosquitto \
mosquitto_passwd /mosquitto/config/passwordfile telegraf
Then did the same to create a user called glowdisplay for the display to use.
I'll likely come back to this at some point and set up some ACLs, but for now, that was Mosquitto set up and good to go.
Configuring the Glow IHD for MQTT
With a broker available, I needed to configure the Glow display to publish into it.
To reach the menu, you hit the Menu button (the three lines), and choose Metering. There's a MQTT option at the bottom of the resulting screen:

Tapping into this option presents a form:

Which expects the following details:
-
Host: IP or hostname of the box running Mosquitto -
Port: 1883 -
Topic:glow -
User: The MQTT user (telegrafin the examples above) -
Password: The password of that MQTT user
Hit save and the display will start publishing into the topic.
Subscribing to the topic
It's now possible to subscribe and see the data that's coming in
docker exec -it mosquitto \
mosquitto_sub -h 127.0.0.1 -t 'glow/#' -p 1883 -P <password> -u admin
After a few seconds, JSON messages will start to appear in (at least) two topics. The first is glow/<your device id>/STATE with the following information
{
 "timestamp":"2023-07-01T11:44:11Z",
 "software":"v1.9.1",
 "hardware":"GLOW-IHD-01-1v4-SMETS2",
 "wifistamac":"<redacted>",
 "smetsversion":"SMETS2",
 "eui":"<redacted>",
 "zigbee":"1.2.5",
 "han":{
   "rssi":-52,
   "status":"joined",
   "lqi":192
   }
}
This provides details about the Glow display itself, including the state of it's connection to the smart meter's Home Area Network.
The second topic is glow/<your device id>/SENSOR/electricitymeter
{
 "electricitymeter":{
    "timestamp":"2023-07-01T11:44:05Z",
    "energy":{
        "export":{
           "cumulative":19.976,
           "units":"kWh"
           },
        "import":{
           "cumulative":90.295,
           "day":3.103,
           "week":32.464,
           "month":3.103,
           "units":"kWh",
           "mpan":"<redacted>",
           "supplier":"EDF",
           "price":{
              "unitrate":0.33980,
              "standingcharge":0.43650
              }
           }
    },
    "power":{
       "value":1.074,
       "units":"kW"
       }
    }
}
We don't currently have an export tariff set up (the MCS cert is taking some time), but once we do, I believe the export tariff details should appear under export .
If you've got a smart gas meter installed too (we don't), you should also see writes into a gasmeter topic (though these will come less frequently - about every 30 minutes).
Configuring Telegraf
With readings now being published into MQTT, the next step was to configure Telegraf to fetch and parse them before writing onward to InfluxDB.
Installing Telegraf is easy, so I'll skip over that.
Although my intention was to update config for an existing telegraf install, I started by creating a new configuration so that I could test my changes first.
cat << EOM > telegraf_test_config.conf
[agent]
  interval = "1m"
  round_interval = true
EOM
Having created the config file, I opened it in an editor in order to add config for the MQTT Consumer plugin.
The first section provides details of how to subscribe to the electricitymeter topic
[[inputs.mqtt_consumer]]
   # replace with the IP/hostname of your MQTT server
   servers = ["tcp://127.0.0.1:1883"]
   # the + is a wildcard, it'll match any single entry
   topics = ["glow/+/SENSOR/electricitymeter"]
   # This will write the topic name into a tag called topic
   topic_tag = 'topic'
   # Use a QOS of 0 (the glow writes in with QOS 0 anyway)
   qos = 0
   max_undelivered_messages = 1000
   # Provide MQTT creds
   username = "telegraf"
   password = "<redacted>"
   # We're going to use xpath to parse
   data_format = "xpath_json"
Next is telling Telegraf which parts of the JSON need to be fields, and which should be tags.
I chose to do this with Xpath as (IMO) it leads to a clean & easily readable config. Note that this section must go directly under the one above
  [[inputs.mqtt_consumer.xpath]]
        # Set the measurement name
        metric_name = "'smart_meter'"
        # Define where to find the timestamp and
        # the format it uses
        timestamp = "/electricitymeter/timestamp"
        timestamp_format = "2006-01-02T15:04:05Z"

      [inputs.mqtt_consumer.xpath.tags]
        # We want each of these to be tags
        mpan = "/electricitymeter/energy/import/mpan"
        import_supplier = "/electricitymeter/energy/import/supplier"
        export_supplier = "/electricitymeter/energy/export/supplier"
        fueltype = "'electricity'"
        # I use this tag to route between outputs in Telegraf
        # you can omit it.
        influxdb_database = "'Systemstats'"

      [inputs.mqtt_consumer.xpath.fields]
        # Define fields
        export_unit = "/electricitymeter/energy/export/units"
        # Use of number() ensures that the value is parsed as a float
        export_cumulative = "number(/electricitymeter/energy/export/cumulative)"
        export_day = "number(/electricitymeter/energy/export/day)"
        export_unit_cost = "number(/electricitymeter/energy/export/price/unitrate)"
        export_standing_charge = "number(/electricitymeter/energy/export/price/standingcharge)"

        import_unit = "/electricitymeter/energy/import/units"
        import_cumulative = "number(/electricitymeter/energy/import/cumulative)"
        import_day = "number(/electricitymeter/energy/import/day)"
        import_week = "number(/electricitymeter/energy/import/week)"
        import_month = "number(/electricitymeter/energy/import/month)"
        import_unit_cost = "number(/electricitymeter/energy/import/price/unitrate)"
        import_standing_charge = "number(/electricitymeter/energy/import/price/standingcharge)"

        power_now = "number(/electricitymeter/power/value)"
        power_now_unitstr = "/electricitymeter/power/units"
If you've got a Smart gas meter (or plan to in the future), you should be able to collect the gas usage data with an extra subscription and some queries against that
[[inputs.mqtt_consumer]]
   # replace with the IP/hostname of your MQTT server
   servers = ["tcp://127.0.0.1:1883"]
   # the + is a wildcard, it'll match any single entry
   topics = ["glow/+/SENSOR/gasmeter"]
   # This will write the topic name into a tag called topic
   topic_tag = 'topic'
   # Use a QOS of 0 (the glow writes in with QOS 0 anyway)
   qos = 0
   max_undelivered_messages = 1000
   # Provide MQTT creds
   username = "telegraf"
   password = "<redacted>"
   # We're going to use xpath to parse
   data_format = "xpath_json"

  [[inputs.mqtt_consumer.xpath]]
        # Set the measurement name
        metric_name = "'smart_meter'"
        # Define where to find the timestamp and
        # the format it uses
        timestamp = "/gasmeter/timestamp"
        timestamp_format = "2006-01-02T15:04:05Z"

      [inputs.mqtt_consumer.xpath.tags]
        # We want each of these to be tags
        mprn = "/gasmeter/energy/import/mprn"
        import_supplier = "/gasmeter/energy/import/supplier"
        fueltype = "'gas'"
        # I use this tag to route between outputs in Telegraf
        # you can omit it.
        influxdb_database = "'Systemstats'"

      [inputs.mqtt_consumer.xpath.fields]
        # Define fields
        import_unit = "/gasmeter/energy/import/units"
        import_cumulative = "number(/gasmeter/energy/import/cumulative)"
        import_day = "number(/gasmeter/energy/import/day)"
        import_week = "number(/electricitymeter/energy/import/week)"
        import_month = "number(/electricitymeter/energy/import/month)"
        import_unit_cost = "number(/gasmeter/energy/import/price/unitrate)"
        import_standing_charge = "number(/gasmeter/energy/import/price/standingcharge)"
Not having a smart gas meter, I've not been able to test this.
In addition to the values collected from MQTT, I also wanted to calculate a couple of additional metrics.
The smart meter exposes the current flow of energy through it in /electricitymeter/power/value. If electricity is being exported, the value will be negative, whilst import will lead to a positive value.
Rather than having to check this at query time, I wanted to calculate the direction of flow and populate three new fields: export_now (float), import_now (float), importing_now (boolean).
The easiest way to implement this sort of logic is with the Starlark Processor. For those not familiar with Starlark, it's a dialect of Python designed for use as a configuration language and so (if you know Python) can easily be used to manipulate metrics:
[[processors.starlark]]
  # Only process metrics with a measurement name of smart_meter
  namepass = ["smart_meter"]

  # Define the Starlark to apply to metrics
  source = '''
def apply(metric):
    # Calculate a field for each of the current import and export
    if "power_now" in metric.fields:
        export = 0.0
        importkw = 0.0
        importing = True

        if metric.fields["power_now"] < 0:
            # Negative, we're exporting
            export = metric.fields["power_now"] * -1
            importing = False
        else:
            importkw = metric.fields["power_now"]

        # Set the fields
        metric.fields["export_now"] = export
        metric.fields["import_now"] = importkw
        metric.fields["importing_now"] = importing

    return metric
  '''
Finally, I added an output plugin so that line protocol would be written to stdout for me to check
[[outputs.file]]
    files = ["stdout"]
With the config built, I ran telegraf:
telegraf --config telegraf_test_config.conf
This then periodically wrote out a line of LP like the following
smart_meter,host=optimus,import_supplier=EDF,influxdb_database=Systemstats,mpan=<redacted>,topic=glow/<redacted>/SENSOR/electricitymeter export_unit_cost=0,export_unit="kWh",power_now=-0.011,power_now_unitstr="kW",export_standing_charge=0,import_unit="kWh",import_cumulative=90.311,import_unit_cost=0.3398,import_standing_charge=0.4365,export_cumulative=19.989,export_day=0,import_day=3.119,export_now=0.011,import_now=0,importing_now=false 1688213315000000000
I decided that it was also worth capturing the display's stats about itself.
For this, I created the following config to subscribe to the STATE topic and extract data.
[[inputs.mqtt_consumer]]
   servers = ["tcp://127.0.0.1:1883"]
   topics = ["glow/+/STATE"]
   topic_tag = 'topic'
   username = "telegraf"
   password = "<redacted>"
   data_format = "xpath_json"

   [[inputs.mqtt_consumer.xpath]]
        metric_name = "'glow_ihd'"
        timestamp = "/timestamp"
        timestamp_format = "2006-01-02T15:04:05Z"

      [inputs.mqtt_consumer.xpath.tags]
        influxdb_database = "'Systemstats'"
        eui = "/eui"

      [inputs.mqtt_consumer.xpath.fields]
        hardware = "/hardware"
        mac = "/wifistamac"
        smets_version = "/smetsversion"
        zigbee_version = "/zigbee"
        han_status = "/han/status"
        han_rssi = "number(/han/rssi)"
        han_lqi = "number(/han/lqi)"
When added to the existing config, Telegraf began to emit Line Protocol like the following
glow_ihd,eui=<redacted>,host=optimus,influxdb_database=Systemstats,topic=glow/<redacted>/STATE han_lqi=192,hardware="GLOW-IHD-01-1v4-SMETS2",mac="<redacted>",smets_version="SMETS2",zigbee_version="1.2.5",han_status="joined",han_rssi=-52 1688215401000000000
All that remained, then, was to have the stats written to InfluxDB.
In my case it was just a case of copying the config stanzas into the config of an existing Telegraf deployment, but if you are building from scratch, you'll want at least one of the two following sections (docs here and here)
# Write to a 1.x compatible instance
[[outputs.influxdb]]
  urls = ["http://192.168.3.84:8086"]
  database = "Systemstats"
  username = "telegraf"
  password = "<redacted>"


# Write to a 2.x compatible instance
[[outputs.influxdb_v2]]
  urls = ["http://127.0.0.1:18086"]
  bucket = "Systemstats"
  token = "<redacted>"
  organization = "<redacted>"
One Telegraf restart later and the metrics are written into InfluxDB
Visualising in Grafana
With usage metrics being written into InfluxDB, it was absolutely trivial to start visualising the data in Grafana.
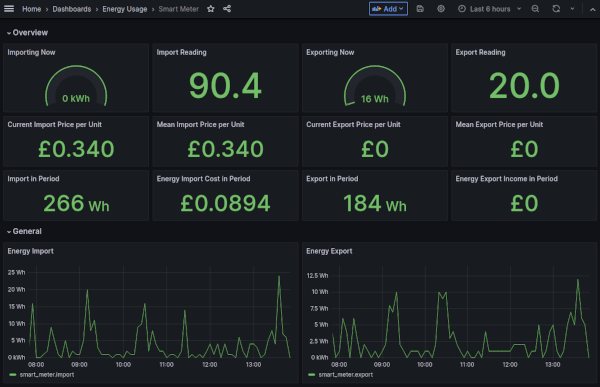
There's very little magic to most of the queries, the current import/export values are all retrieved with variations of this InfluxQL query
SELECT
   last("import_now")
FROM "Systemstats"."autogen"."smart_meter"
WHERE $timeFilter
GROUP BY time($__interval) fill(null)
The "In Period" stats simply subtract the first from the last cumulative reading:
SELECT
  last("import_cumulative") - first("import_cumulative")
FROM "Systemstats"."autogen"."smart_meter"
WHERE $timeFilter
The Import costing (and export value) calculates the import cost per 5 minutes and then totals it
SELECT
   sum("import_cost") AS total_cost
FROM (
   SELECT
     non_negative_difference(max("import_cumulative")) * mean("import_unit_cost")AS "import_cost"
   FROM "Systemstats"."autogen"."smart_meter"
   GROUP BY time(5m)
)
WHERE $timeFilter
It does it this way (rather than calculating total consumption and then multiplying by cost) to account for variable tariffs. If we later move onto something like Octopus Agile, per-unit prices might change every 30 minutes.
A version of that query, but without the final sum, is also used to chart cost over time:

An exported copy of this dashboard can be found in my Github repos.
Downsampling
Having stats come in every few seconds is great, but I don't really need that level of granularity for very long: I retain the raw data for about a week, but for longer retention downsample into 15 minute aggregates using my downsampling utility.
Most of the metrcis are cumulative counters, so I prefer to aggregate those using max(). Some of the fields though, are point-in-time values so I want to apply multiple aggregates to those.
My downsampling jobs are defined using YAML:
downsample_smart_meter_stats_max:
    # Name for the task
    name: "Downsample Smart Meter Stats (Max)"
    influx: home1x

    # Query the last n mins
    period: 120

    # Window into n minute blocks
    window: 15

    # bucket and measurement(s) to query
    bucket: Systemstats
    measurement:
        - smart_meter

    # Fields to retrieve
    fields:
        - export_cumulative
        - export_day
        - export_unit_cost
        - import_cumulative
        - import_day

    aggregates:
        max:

    output_influx:
        - influx: home2xreal
    output_bucket: Systemstats/rp_720d


downsample_soliscloud_stats_multistats:
    name: "Downsample Smart Meter Stats (Multiple Outputs)"
    influx: home1x

    period: 120
    window: 15

    bucket: Systemstats
    measurement:
        - smart_meter

    fields:
        - export_now
        - export_unit_cost
        - import_unit_cost
        - import_standing_charge
        - import_now
        - power_now

    aggregates:
        min:
            field_suffix: "_min"
        max:
            field_suffix: "_max"
        mean:
        percentile:
            - 95
            - 50

    output_influx:
        - influx: home2xreal
    output_bucket: Systemstats/rp_720d
The result is that my downsampled data contains mean, min, max, median and p99 stats for import and export rates and cost, whilst the use of max() on the cumulative counters means that I have a meter reading for the end of each of those 15m periods.
Linking to HomeAssistant
Some enterprising users have linked Glow to HomeAssistant (allowing automations to be triggered based on import/export rates and/or pricing information), so I also wanted to get that up and running.
I'm not there yet, but with Glow and my solar inverter linked to HomeAssistant, I'll be able to do things like automate charge/discharge of the solar battery depending on flexible tariff prices etc.
Obviously I now already had a MQTT broker, so I didn't need to stand one up within HomeAssistant, instead I just needed to configure it to subscribe and create sensors based on the resulting data.
So in HomeAssistant's UI, I went: Settings -> Device and Integrations -> Add Integration -> MQTT -> MQTT
This then prompted for broker details:

After hitting Submit then Finish, the integration appeared in the list.
I now needed to tell HomeAssistant how to parse the data received via subscription into Entities. Currently, that can't be done via the UI and can only be achieved by editing HomeAssistant's configuration.yaml
To do so, I used a variation of SpeakToTheGeek's configuration:
mqtt:
  sensor:
    - name: "Smart Meter Electricity: Power"
      unique_id: "smart_meter_electricity_power"
      state_topic: "glow/+/SENSOR/electricitymeter"
      device_class: "power"
      unit_of_measurement: "W"
      state_class: "measurement"
      value_template: "{{ (value_json['electricitymeter']['power']['value'] * 1000) | round() }}"
      icon: "mdi:flash"

    - name: "Smart Meter Electricity: Energy Import"
      unique_id: "smart_meter_electricity_energy_import"
      state_topic: "glow/+/SENSOR/electricitymeter"
      device_class: "energy"
      unit_of_measurement: "kWh"
      state_class: "total_increasing"
      value_template: >
        {% if value_json['electricitymeter']['energy']['import']['cumulative'] == 0 %}
          {{ states('sensor.smart_meter_electricity_energy_import') }}
        {% else %}
          {{ value_json['electricitymeter']['energy']['import']['cumulative'] }}
        {% endif %}
      icon: "mdi:flash"

    - name: "Smart Meter Electricity: Energy Export"
      unique_id: "smart_meter_electricity_energy_export"
      state_topic: "glow/+/SENSOR/electricitymeter"
      device_class: "energy"
      unit_of_measurement: "kWh"
      state_class: "total_increasing"
      value_template: >
        {% if value_json['electricitymeter']['energy']['export']['cumulative'] == 0 %}
          {{ states('sensor.smart_meter_electricity_energy_export') }}
        {% else %}
          {{ value_json['electricitymeter']['energy']['export']['cumulative'] }}
        {% endif %}
      icon: "mdi:flash"

    - name: "Smart Meter Electricity: Import Unit Rate"
      unique_id: "smart_meter_electricity_import_unit_rate"
      state_topic: "glow/+/SENSOR/electricitymeter"
      device_class: "monetary"
      unit_of_measurement: "GBP/kWh"
      state_class: "measurement"
      value_template: "{{ value_json['electricitymeter']['energy']['import']['price']['unitrate'] }}"
      icon: "mdi:cash"

    - name: "Smart Meter Electricity: Import Standing Charge"
      unique_id: "smart_meter_electricity_import_standing_charge"
      state_topic: "glow/+/SENSOR/electricitymeter"
      device_class: "monetary"
      unit_of_measurement: "GBP"
      state_class: "measurement"
      value_template: "{{ value_json['electricitymeter']['energy']['import']['price']['standingcharge'] }}"
      icon: "mdi:cash"
With that appended to configuration.yaml, I restarted HomeAssistant and the entities became visible:

These then needed to be made available to the Energy dashboard, however, it doesn't handle cumulative counters directly: a helper needed to be created to turn the counter into a daily read.
In HomeAssistant: Settings -> Devices & Services -> Helpers (at the top) -> Create Helper -> Utility Meter

I set the following:
- Name: Smart Meter Daily Import
- Input Sensor:
sensor.smart_meter_electricity_energy_import - Meter Reset Cycle:
Daily
and then repeated the process to create the export meter
Clicking the Energy dashboard on the left led to the following screen

I needed to wait a little while before proceeding, because the entities don't show up until they've registered some non-0 reads (i.e power has been both imported and exported). If one appears, the other can always be added later though.
I added the Smart Meter Daily Import sensor as the Grid consumption source. Then selected Use an entity with current price and choose the Import Unit Rate sensor before clicking Save.
I then clicked Add Return under Return to Grid before adding the Smart Meter Daily Export entity.
Once they'd all been added, I clicked Next until I was shown the new energy dashboard

It's possible to add more sources later by going to Settings -> Dashboards -> Energy.
At some point, I'll probably use InfluxDB Queries to create sensors making Panel and Battery state available in HomeAssistant too.
Conclusion
Standing up a Mosquitto MQTT instance and configuring the Glow IHD to talk to it really was unbelievably easy. As a result, it then didn't take much effort to have Telegraf fetch our usage stats and write them into InfluxDB.
One of the things that I've historically poured scorn on Smart Meters for is the horrendous granularity of the stats they report. Even 20 minute intervals are too great for current data, especially when you consider that off the shelf hardware like the Owl Intuition-e manages to report at 20 second intervals.
If the aim of smart meters really is to help consumers reduce their energy usage, low granularity stats just don't cut it. 20 minutes is more than long enough for a fridge's compressor to kick in and mess with the results of anything the householder might be trying: the provider's IHD might show now() in realtime but most don't let you look back with any meaningful granularity.
The Hildebrand Glow IHD isn't exactly a cheap bit of kit (though it is cheaper than the Owl Intuition) - presumably, in part, because the company will need to comply with DCC requirements in order to function at all.
But, it helps provide a decent insight into energy usage and (for those on variable tariffs) cost.
Its ability to expose costs, actually, is quite an important factor for me. When writing about monitoring our solar install I noted that Owl Intuition was my source of truth for tariff information, because I didn't want to have to manually update multiple locations.
With the Glow feeding data into InfluxDB, though, there's no longer any requirement that I manually update costs at all: if our tariff changes, the new rate will automatically be reported into InfluxDB for use in dashboard calculations (or, so you would hope - in actuality, my latest figures are wrong because EDF have failed to update the meter with a tariff change that came into effect 3 days ago).
So despite (widespread) cynicism, Smart Meters really do have the potential to lower energy usage and costs. There are problems with the technology (the ease of remote disconnection being a huge one) but overall the main problem is with the way that they're being deployed, and in particular the lack of tooling provided by the energy providers themselves.
Most households aren't going to be interested in building things in the way that I am, but the simple fact is that they shouldn't need to, because providers should be building tooling to help identify and reduce sources of excess consumption.
The availability of third party IHD's like the Glow (as well as things like the Octopus Home Mini) help to mitigate the shortcomings (or absence) of supplier tooling, and getting information from the Glow into InfluxDB and HomeAssistant is easy, enabling the development of visualisation, alerting and automation based on real-time energy usage information.