Reviewing our Solar Battery Savings
A couple of weeks ago, I realised I'd made a horrendous reporting mistake which negatively skewed our view of solar battery performance whenever the battery was charged from the grid.
Aside from there being a bit of egg on my face, this also meant that I needed to re-assess various charging approaches, including whether shaving the morning pricing peak is worthwhile.
I've now had a couple of weeks of watching closely whilst double checking the calculations that my reporting system performs each day.
By happenstance, we've also had very few Octopus Power-ups during that period. Obviously, not getting free electricity is disappointing, but removing their impact from amortisation stats does make it a little easier to assess the benefits that the battery is bringing.
In this post, I'll talk a little about what I've been doing, look at the savings our battery has yielded over the last 14 days and look at why some days report lower stats (or go negative).
The Weather
The first thing to note though, is changes in weather: although we had a brief patch of "normal" weather in September, it's still unseasonably sunny.
If we look at stats from my weather station, though, there's definitely a downward trend in sunlight levels:

Unsuprisingly, this has resulted in the panels producing less and less each day:

This is important because that loss of solar energy translates into a greater need to take energy from the grid, giving us opportunity to achieve savings by charging the battery ahead of peak pricing periods.
Charging Twice Daily
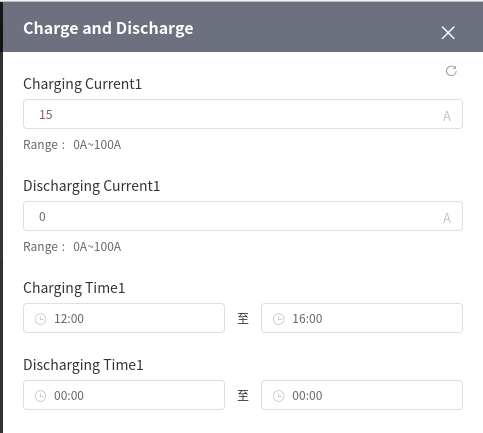
As I've lamented in the past, I don't currently have the means to build automation that can dynamically adjust when the battery charges - instead I have a simple scheduler allowing scheduling of up to 3 periods a day:
When I first started experimenting with grid charging, I only had a single daily charge scheduled, in the hours running up to peak pricing.
Later, though, I decided it was worth taking a closer look at the (smaller) pricing peaks that occur each weekday morning:

My original experimentation with charging to shave this peak failed horribly, however, that outcome was heavily influenced by the bug in my metrics calculations scripts.
So, I decided to revisit it by re-enabling the morning charge. So, I configured the battery to charge from the grid between 02:00 and 06:00
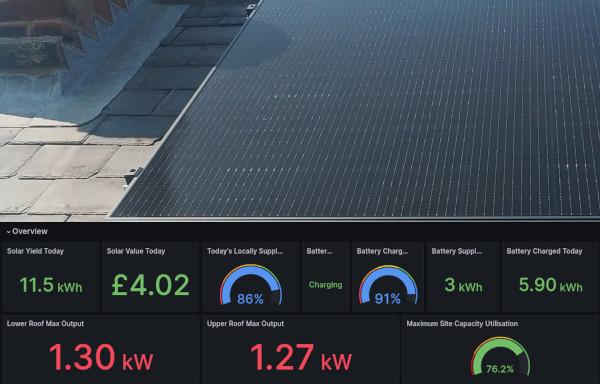
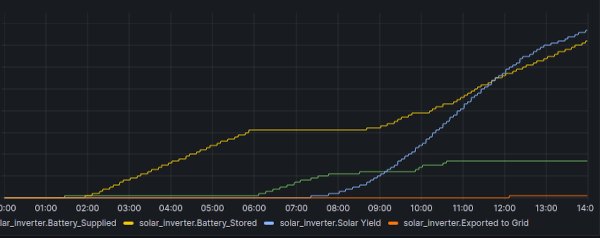
Impact on Battery Charge Levels
The impact on battery charge level was pretty immediate, and not overly surprising:
SELECT
    max("batteryPowerPerc") AS "max_batteryPowerPerc"
FROM "Systemstats"."rp_720d"."solar_inverter"
WHERE
   $timeFilter
GROUP BY time($__interval)
FILL(null)

After the change was made on the 24th, we started having two charge peaks a day, with neither of the scheduled charges generally leading to the battery becoming fully charged.
We only perform partial charges in order to maximise the chances of energy being used when prices are higher than (or at least, equal to) the price paid when charging the battery.
This is particularly important for the morning charge, because daytime prices do sometimes drop. For example, if we look at pricing for the morning of the 30th of September:

The battery's scheduled charge runs between 02:00 and 06:00 (the blue section). The morning's peak prices occur between 06:30 and 10:30 and then prices begin to drop (the red section).
Once we get into that red section, electricity prices are (increasingly) lower than the price paid to charge the battery: every kWh we draw from the battery in that period represents a small financial loss.
So, it's important to try and ensure that the battery doesn't charge to the point that it's still discharging during the red period.
This is a fairly inexact science, because there are a bunch of unknowns:
- How much energy will we consume that morning?
- What's the weather going to be like: will the panels pick up some of the load?
- What will pricing do - is there an extended peak or do prices drop?
The latter two, of course, could be addressed if it were possible to dynamically vary the charging schedule.
The Impact
I had been expecting relatively meagre savings increases, but the difference is pretty hard to miss:

There is, however, also an element of luck driving the scale of this improvement: We've really been quite fortunate with pricing, rates have been dropping quite heavily overnight.

It's really quite hard not to make some kind of a saving when you can charge the battery for free, or even get paid to charge it.
The important thing, though, is that the savings do not appear to be driven solely by those drops in pricing: Even days with smaller overnight drops still show some form of saving.
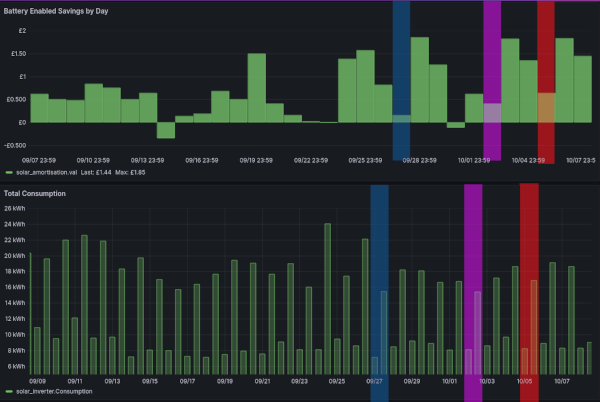
In fact, if we look at battery savings since around the time our export tariff kicked in, we can see that, although there are low days, savings are definitely growing:

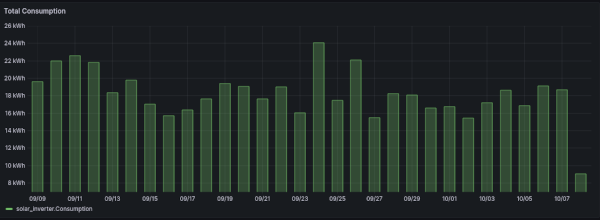
My first assumption was that the lower savings probably correlate with lower consumption (after all, you can't unlock a saving if you don't use the energy in the first place). But, when looking at a daily view, there's no reliable correlation between the two:
Things get a little more interesting, though, if we break the consumption up into 12h periods (i.e. separate morning and evening)
Whilst there's no particular correlation between lower savings and daily consumption levels, there is a reasonable correlation with afternoon/evening consumption.
A few examples of this are highlighted in the screenshot below, the lower savings days correlate with a slightly lower afternoon consumption.
In fact, that same correlation exists even before the morning charge periods were introduced.
Somewhat unsurprisingly, we unlock most savings during peak pricing periods, because every single kWh is just worth more.
30th September
Earlier in this post, we looked at pricing for 30th September, noting that there was a relatively short window where morning usage could be profitable.
As the graphs above show, the 30th of September actually tipped into negative savings.
This happened because the battery continued to supply energy for longer than intended. In the morning, the battery supplied energy beyond the morning peak, taking us into the red zone.
However, it wasn't just (or even mostly) the morning that suffered from this issue.
Our peak time usage was extremely low (basically, non-existent in fact) and so the battery carried on supplying until the next day's charge cycle started

Although the energy all, ultimately, got consumed, this led to a statistical anomaly. Battery savings are calculated at a per-day granularity and, when the day rolled over, the battery still had a 40% charge - we'd "paid" to charge that 40% but essentially lost that value when the day ended.
In practice, of course, that remaining value led to a slight boost in the numbers for the next day, so weekly figures (or even averaged daily figures) don't show an overall reduction.
So, whilst it is useful to look into why a single day fared badly, it's probably unwise to focus too much on individual day-by-day stats.
Conclusion
We look, generally speaking, to be on the correct path: shaving the morning peak unlocks additional savings, helping a little with the battery's dire amortization figures.
Although the morning savings are helpful, the overall profitability of any given day is still heavily swayed by what we do in the evenings. If we don't consume heavily enough during peak times, the resulting savings are quite stunted and can even lead to losses being included in the daily reports.
Currently, we tend to turn appliances on in the morning (at least, unless there's a Power-up). If (on days where we don't use the oven), we turn those appliances on in the evening instead, the amortisation stats would likely report greater savings. As I've noted before, though, that's a path with no real gain.
I think we've probably reached the point that it isn't possible to tune the system for (meaningful) further gains without either:
- Adding kit to allow dynamic automation, or
- Getting in the habit of configuring manually rather than automating
Relying on lots of manual changes is a recipe for mistakes, so until I get around to doing the first, I'll probably settle for looking at the graphs periodically and adjusting schedules if Octopus Agile pricing trends start to shift too much.