Correcting My Grid Charge Calculations

I've been looking for ways to improve our (somewhat dire) solar battery savings ever since I calculated the daily savings that we were achieving.
One of the approaches that I identified and tried was scheduling grid charging in order to increase the level of use that the battery saw - the idea being that the battery would see use even on cloudy days, with more use generally equating to greater savings.
When I reviewed this change recently, I was quite disappointed to find that it had had quite a mixed effect, with negative savings occurring much more frequently than before. This wasn't entirely unexpected, as an inability to dynamically schedule charging means that we buy power in at the same time each day, regardless of price or consumption expectations.
Today, however, I found that these negative savings were actually the result of a (stupid) reporting bug in the grid-charging calculations and that grid-charges deliver better savings than previously reported.
In this post I talk a little about the bug itself as well as looking at the re-calculated figures.
The Bug
Let's start by looking at how (and why) I fucked up.
The TL:DR is complexity.
My solar amortisation calculations are performed by a Python script and the overall system is designed to be quite DRY.
Most of the values being calculated derive from the same few raw fields - tariff values and kWh counters. So, rather than querying the same underlying data repeatedly, I calculate and store some key metrics which are later consumed and adjusted in order to calculate derived values.
This isn't done just for efficiency's sake, it also allows my reporting to abstract generalised figures (like amortisation rates) away from specialised figures (like Octopus pricing information) in order to build a (fairly) normalised schema. If I change energy provider (or tariff) in future, there should be no need to change the schema or the queries used to retrieve stored amortisation values.
Calculating battery unlocked savings is relatively complex, with multiple possible input and outputs, so some of this complexity existed even before I implemented the python script. My PoC dashboard used multiple Flux queries and a complex chain of Grafana transforms:
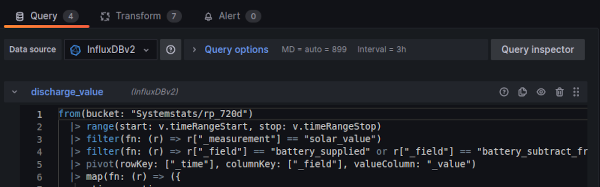
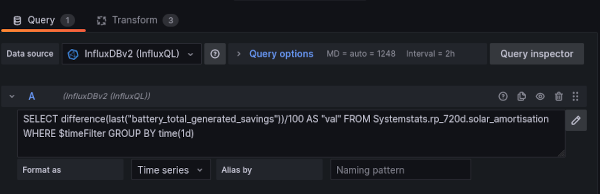
Obviously, having each dashboard cell run and combine multiple queries before applying a chain of transforms is a recipe for mistakes (hah!) and therefore entirely unmaintainable. So, at the beginning of August, I built the Python script, which allowed the Grafana cells to be driven by a single simple query
The remaining transforms don't actually interact with the data at all, they simply apply a timeshift to make column charts a little easier to read.
Schema Complexity and Naming
The data that the Python script queries is generated by downsampling tasks, each of which take raw data and outputs 30 minute aggregates.
For example, the following query takes my solar inverter's cumulative counters and combines them with Octopus tariff information in order to calculate what the equivalent export value of the energy stored to the battery would be:
pricing = from(bucket: "Systemstats/autogen")
    |> range(start: v.timeRangeStart, stop: v.timeRangeStop)
    |> filter(fn: (r) => r._measurement == "octopus_pricing"
        and (r._field == "cost_inc_vat" or r._field == "override_price")
        and r.charge_type == "usage-charge"
        and r.tariff_direction != "EXPORT"
        )
    |> filter(fn: (r) => r.payment_method == "None")
    |> keep(columns: ["_time","_field","_value"])
    |> pivot(rowKey: ["_time"], columnKey: ["_field"], valueColumn: "_value")
    |> map(fn: (r) => ({
        _field: "cost_inc_vat",
        _time: r._time,
        _value: if exists r.override_price then r.override_price else r.cost_inc_vat
        }))
    |> aggregateWindow(every: 30m, fn: max)
battery_charge = from(bucket: "Systemstats/autogen")
    |> range(start: v.timeRangeStart, stop: v.timeRangeStop)
    |> filter(fn: (r) => r._measurement == "solar_inverter"
        and (r._field == "batteryChargeToday"
        ))
    |> aggregateWindow(every: 30m, fn: max)
    |> difference(nonNegative: true)
    |> keep(columns: ["_time","_field","_value"])

join(tables: {price: pricing, activity: battery_charge}, on: ["_time"])
|> map(fn: (r) => ({
    _time: r._time,
    _value: r._value_activity * r._value_price,
    _field: "battery_stored_value_if_exported",
    _measurement: "solar_value"

}))
The important thing to understand about this query is that it does two things:
- Calculates how much energy was stored into the battery
- Multiplies that by the export unit price
The resulting value is the "opportunity cost" of the stored energy - what we could have earned in export revenue instead.
But, this query makes no accommodation (at all) for charging the battery from the grid: Grid charging incurs no opportunity cost because the electricity was never ours to sell in the first place (and we've instead paid import prices to acquire it).
Grid charge values are calculated in a separate (and, necessarily, much more complex) query, which includes the following field calculations:
export_value = join(tables: {price: export_pricing, yield: charged}, on: ["_time"])
|> map(fn: (r) => ({
        _time: r._time,
        _value: r._value_price * r._value_yield,
        _field: "battery_subtracted_from_exported_value",
        _measurement: "solar_value"
    }))
|> fill(value: 0.00)


import_value = join(tables: {price: import_pricing, yield: charged}, on: ["_time"])
|> map(fn: (r) => ({
        _time: r._time,
        _value: r._value_price * r._value_yield,
        _field: "battery_charged_from_grid_cost",
        _measurement: "solar_value"
    }))
|> fill(value: 0.00)
The result is two fields
-
battery_charged_from_grid_cost: What we paid to buy the electricity to charge the battery -
battery_subtracted_from_exported_value: What we should subtract from the total opportunity cost to reflect there was none for this energy
Rather than repeatedly querying the same raw stats, the idea was that the Python script would "credit" battery_subtracted_from_exported_value back during the opportunity cost calculations.
Grid charging isn't the only element that works this way, if energy is exported from the battery there's also a separate credit to be applied.
Which, is part of how the issue crept in.
Simplifying with Python
The Python script's battery savings calculation looked like this
def calculate_battery_savings(metrics):
    ''' Calculate how much money the battery has saved
    '''

    output = metrics["battery_supplied"] + metrics["battery_exported_value"]

    # Credit back opportunity cost
    output_with_credit = output + metrics["battery_exported_value"]

    # opportunity cost + charged from grid
    input_cost = metrics['battery_stored_value_if_exported'] + metrics["battery_charged_from_grid_cost"] + metrics["battery_subtract_from_consumed_value"]

    return output_with_credit - input_cost
There's no denying that it's far simpler to follow and read than the Flux and Grafana mash-up that it was replacing.
But, there's a problem:
# Credit back opportunity cost
output_with_credit = output + metrics["battery_exported_value"]
The script isn't crediting battery_subtracted_from_exported_value back.
This oversight, really, stems from the naming that I've used.
The function passes a quick review, after all, we are crediting something export related back. The problem is, it's only one of the two credits required.
It's true that the missing field was intended to be subtracted from the equivalent export value (or opportunity cost), but that's not what its name implies. The field name that we're missing includes from_exported_value, so why would we apply it here?
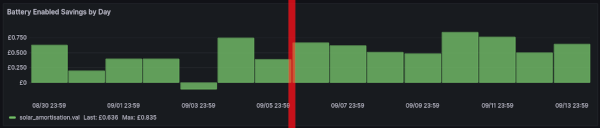
Without this credit, the calculations effectively levy an opportunity cost of £0.15 on each kilo-watt hour charged from the grid which, as we saw in my earlier post, does not lead to a happy result:
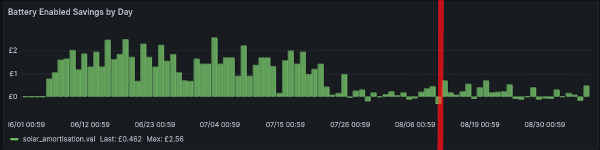
(Red line is where I first enabled grid charging)
Finding The Bug
The earlier results, whilst unwelcome, are unfortunately quite plausible: Buying electricity from the grid in the hopes that we can consume at a higher equivalent value is a gamble - it's betting that enough of the energy will be consumed at a higher price to offset the initial import cost.
Detection of this was further confounded by quite a high level of irregularity in day-to-day pricing and consumption. We've been lucky enough to benefit from quite a few Octopus Powerups, giving us a couple of hours of free electricity to charge the battery with. Those days, as expected, showed a higher rate of savings, implying that things were working as they should.
Ultimately, it was "Plunge Pricing" (prices going negative) that led to me finding this issue today.
I was concerned that the calculations might not handle negative pricing correctly (NB: turns out that they do) and had built a driver to test the calculate_battery_savings function against a range of scenarios
def calculate_metrics(charged_unit_cost, consumed_unit_cost):
    ''' Build a metrics dict based on 10kWh being charged and then
        discharged.

        Arguments provide the unit cost at time of charging and
        discharging.

        Export value is a fixed value (0.15 kWh)

        Export from battery is 0 (leading to battery_subtract_from_consumed
        also being 0)
    '''
    return {
        "battery_stored_value_if_exported" : 10 * 0.15,
        "battery_supplied" : 10 * consumed_unit_cost,
        "battery_charged_from_grid_cost" : 10 * charged_unit_cost,
        "battery_exported_value" : 0,
        "battery_subtract_from_consumed_value" : 0
    }

# Specify the prices to use during testing
pricing = [
    # negative charge rate, positive discharge
    [-0.05, 0.1],

    # negative charge rate, more negative discharge
    [-0.05, -0.1],

    # negative charge rate, less negative discharge
    [-0.05, -0.02],

    # positive charge rate, negative discharge
    [0.05, -0.1],

    # positive charge rate, positive discharge
    [0.05, 0.1],

    # positive charge rate, less positive discharge
    [0.05, 0.02],

    # equal positive charge rate
    [0.05, 0.05],

    # equal negative charge rate
    [-0.05, -0.05]
]

# Calculate each
for i in pricing:
    metrics = calculate_metrics(i[0], i[1])
    #print(metrics)
    saving = calculate_battery_savings(metrics)
    print(f"{i} = {saving}")
The final two tests, logically, should both result in a saving of 0 because we bought and consumed at exactly the same rate. Yet, the output indicated a loss
ben@optimus:~$ python3 tmp/test_saving.py
[-0.05, 0.1] = 0.0
[-0.05, -0.1] = -2.0
[-0.05, -0.02] = -1.2
[0.05, -0.1] = -3.0
[0.05, 0.1] = -1.0
[0.05, 0.02] = -1.8
[0.05, 0.05] = -1.5
[-0.05, -0.05] = -1.5
This loss was exactly the value of battery_stored_value_if_exported, highlighting that credits weren't being applied.
The fix was quite simple, I just needed to have the script actually credit battery_subtracted_from_exported_value back:
def calculate_battery_savings(metrics):
    ''' Calculate how much money the battery has saved
    '''

    output = metrics["battery_supplied"] + metrics["battery_exported_value"]

    # Credit back opportunity cost
    output_with_credit = sum([
        output ,
        metrics["battery_exported_value"],
        metrics["battery_subtracted_from_exported_value"]
        ])

    # opportunity cost + charged from grid
    input_cost = sum([
        metrics['battery_stored_value_if_exported'],
        metrics["battery_charged_from_grid_cost"],
        metrics["battery_subtract_from_consumed_value"]
        ])

    return output_with_credit - input_cost
Corrected Values
With the script corrected, I re-ran it, obtaining a pleasing improvement in reported battery savings
Before:

After:

There are still some days where we made a loss (the final one being entirely my fault), but the vast majority are now positive (the details of that bumper day on the 20th are covered below).
The Benefit of Grid Charging
So, what impact has this had on the reported values?
The following query extracts the average daily battery saving since I enabled grid charging
SELECT
   mean("val")
FROM (
   SELECT
      difference(last("battery_total_generated_savings"))/100 AS "val"
   FROM Systemstats.rp_720d.solar_amortisation
   WHERE
      time > '2023-09-11T00:00:00Z'
   GROUP BY time(1d)
)

The same query can be used with a different date range to get the mean battery saving before I introduced grid charging, but after our export tariff kicked in
SELECT
   mean("val")
FROM (
   SELECT
      difference(last("battery_total_generated_savings"))/100 AS "val"
   FROM Systemstats.rp_720d.solar_amortisation
   WHERE
      time < '2023-09-11T00:00:00Z'  and time > '2023-07-25T00:00:00Z'
   GROUP BY time(1d)
)

So, despite initial appearances to the contrary, enabling grid charging has driven the average daily saving up by a little shy of 53%!
Impact on Amortisation Time
Whilst this increase is, undoubtedly, good news, it has very little impact on my initial concerns: at the current rate of savings, the battery is still going to take more than its serviceable lifetime to break even with its purchase price.
However, the updated figures show that, with grid charging, the battery should be able to continue to deliver reasonable value in the winter months (when solar will be contributing much less).
With a bit of luck, increased wind in Winter will mean that Agile prices drop more frequently allowing me to better capitalise on having that storage available.
With both an Octopus Powerup and plunge pricing, the 20th of September showed just how well things can work out:
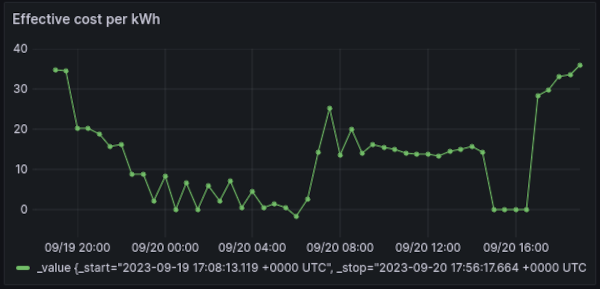
Because of the drop in prices overnight, I was able to charge the battery up until immediately before we got up, shaving the morning peak and running from the battery until nearly lunch-time, followed by a mid-afternoon freebie charge.
Speaking of shaving the peak, the mistake obviously had the potential to invalidate my findings when experimenting with cutting morning peak costs.
The values for that period are no longer negative, and although the (non-sunny) days don't really outperform the prior week by very much, there is a definite sign of improvement:
It's only a few days worth of data, but the morning charge is obviously well worth revisiting.
Conclusion
Fuck, I mean... fuck. What a bloody stupid mistake to let creep in. The underlying Flux query made the information available but I wasn't consuming it because of complexity in my design.
The irony is, this mistake crept in whilst seeking to simplify things to reduce the chances of this kind of mistake creeping in.
This simple mistake meant that my calculations were - in effect - overcharging for each unit of electricity, skewing the values reported since I first enabled regular grid charging early last month. Despite the values being incorrect, the exhibited pattern of behaviour largely conformed with the pattern that I was expecting, leading to them essentially affirming their own validity.
Mea Culpa.
Correcting the mistake has led to a respectable increase in the reported savings, even if not enough to (yet) make the battery a worthwhile purchase overall. However, the newly reported improvement from shaving the morning peak does suggest that there may yet be scope to drive daily savings higher.