2023 Solar Performance
Over the course of the year I've published various posts looking at the performance of our solar install, so as 2023 has now rolled over into 2024, it seemed worth posting a summary of performance across that year.
The system was installed at the end of May so we've not had a full year (and due to delays in the install, missed some absolutely cracking weekends), though we did get all of Summer.
Unlike my others, this post does not go into much depth - it simply looks at overall performance and a few trends across the year.
Install Overview
We've got
- 2 east facing arrays of panels
-
6 kWhof raw battery capacity, provided by 3 Pylontech US2000 battery units - A Solis 3101 inverter
The inverter sends stats to Soliscloud which I then pull into InfluxDB with Telegraf (there's a copy of the telegraf plugin here).
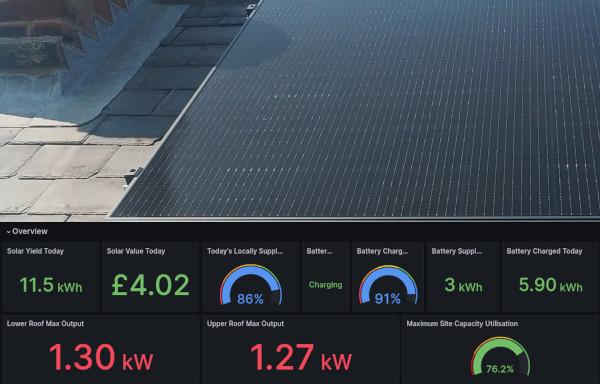
Headline Figures
Across the period, the headline figures are as follows
- Energy Generated:
1.6 MWh - Import value of generated energy:
£382 - Battery Charged (inc Grid charges):
1.28 MWh - Battery Supplied:
1.8 MWh - Exported:
144 kWh
Note: the import value is based on the price at the time that the energy was generated. We're on Octopus Agile so it varies throughout the day, but is often cheaper than a fixed tariff (by way of comparison, if we were still on our previous fixed-price tariff the import value would have been £560).
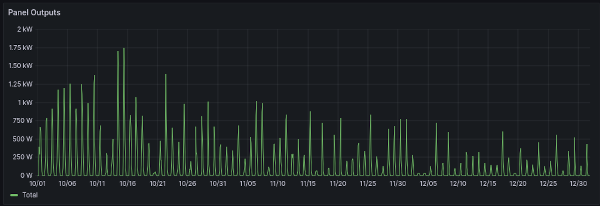
Generation Timings
Weather information is collected by an Ecowitt weather station in our garden.
The summer saw some quite intense (at least, for the UK) periods of sunshine, with levels trending downwards as Winter rolled around:

The total time that the sun was shining can be calculated with the following Flux query:
from(bucket: "weather/downsampled")
  |> range(start: 2023-05-31T00:00:00Z, stop: 2023-12-31T23:59:59Z)
  |> filter(fn: (r) => r._measurement == "weather")
  |> filter(fn: (r) =>r._field == "solarradiation")
  |> drop(columns: ["model", "submitted_by"])
  |> aggregateWindow(every: 1m, fn: max)

  // Strip any empty windows
  |> filter(fn: (r) => exists r._value)

  // Calculate time in state
  |> map(fn: (r) => ({r with
     state: if r._value > 0 then
                 "shining"
            else
                 "down"
  }))
  |> elapsed(unit: 1s)
  |> filter(fn: (r) => r.state == "shining")
  |> sum(column: "elapsed")
There were 2994.75 hours (equivalent to 124 days) of measurable sunlight.
Of that time, our panels spent 2819.75 hours (equivalent to 117 days) outputting at least some energy.
However, that figure includes times when only small amounts of energy were trickling out of the panels. If we instead check time spent generating more than 100W:
from(bucket: "Systemstats")
  |> range(start: 2023-05-31T00:00:00Z, stop: 2023-12-31T23:59:59Z)
  |> filter(fn: (r) => r._measurement == "solar_inverter")
  |> filter(fn: (r) => r._field == "panel_1" or r._field == "panel_2")
  |> aggregateWindow(every: 5m, fn: max)
  |> group()
  |> aggregateWindow(every: 5m, fn: sum)
  |> filter(fn: (r) => exists r._value)
  |> map(fn: (r) => ({r with
     state: if r._value > 100 then
                 "active"
            else
                 "down"
  }))
  |> elapsed(unit: 1s)
  |> filter(fn: (r) => r.state == "active")
  |> sum(column: "elapsed")
This drops to 1946 hours (81 days).
The scale of this drop is not overly surprising: from October onwards, there were quite a few days where the daily peak output was less than 100W
Exports
Export volumes show a slightly unexpected pattern:

Exports dying off at the end of summer isn't too surprising. The subsequent increase through November and December, though, isn't something that I'd expected when the system was being installed.
That export is the result of Octopus Savings Sessions (part of the wider Demand Flexibility Service).
During Savings Sessions, Octopus pay an enhanced unit rate (at one point, £4/kWh) for exported energy, so it was well worth pre-charging the battery from the grid in order to sell it back once a saving session started (in turn, helping the grid load-shift a little).
That period also saw quite a few windy days:
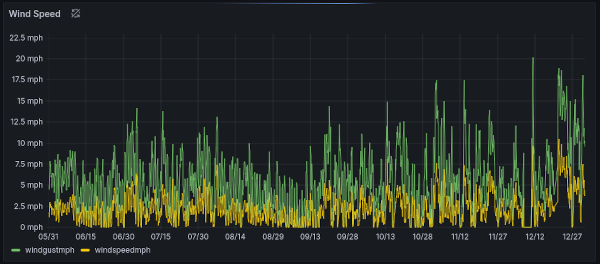
The resulting increase in wind energy translated to a reduction in import prices:

With import prices dropping below Octopus's fixed export value (£0.15/kWh) we were able to grid-charge cheaply before exporting anything that we didn't need.
Battery Health
The battery's reported state-of-health (SOH) dropped by 1% during the period

Around the end of November, the inverter started quite regularly raising battery under voltage (UN-Vbatt) alerts towards the end of the discharge cycle. Not long after this, our installer circulated a manufacturer recommendation that minimum state-of-charge (SoC) be set to 35% during the winter months (other manufacturers, it seems, go even further).
This reduced our usable capacity, but also stopped the alarms.
More recently, I have adjusted the nightly charge cycle to ensure that the batteries reach 100% at least once a day.
Changes expected in 2024
The headline figures for 2024 should be much higher:
- It'll be a full year rather than 6 months
- I intend to get automation up and running so that exports and charges can trigger automatically
- Electricity prices are expected to remain high (although there may be a welcome drop in April)
- Battery SOH is likely to drop at a faster rate as a result of discharging the battery more frequently