Tracking and Alerting on LetsEncrypt Certificate Renewals With InfluxDB and Kapacitor
LetsEncrypt has been providing free SSL certificates since 2014, and has seen widespread usage.
With a 90 day lifetime, the certificates only have relatively short lifespans and need renewing regularly, with the recommended way being to automate renewal using certbot.
The relatively short lifetime of these certificates means there's also a fairly short window to notice and intervene if renewal fails (whether because you've hit LetsEncrypt's rate limits, because certbot has started failing to fire, or some other reason).
Service monitoring often includes a check that connects in and checks certificate expiration dates, but there's usually a window between where a certificate should have renewed and when it gets close enough to expiry to breach your alert threshold.
If we apply a defense-in-depth mindset, there should also be monitoring of the renewal process itself: not only does this provide an earlier opportunity to trigger an intervention, it also addresses the risk of reliance on a single health check (which might itself malfunction).
This post covers the process of configuring a post-deploy hook in certbot to write renewal information into InfluxDB so that alerts can be generated when an expected renewal is missed.
The Hook
The script is pretty simple and can be seen here. It's dependencies have been kept light, needing only requests outside of the packages commonly available on a system with certbot installed.
When certbot triggers the hook, it exports a couple of environment variables
-
RENEWED_LINEAGE: provides paths to the certs on disk (we don't care about these in this case) -
RENEWED_DOMAINS: A space seperated list of domains that were (successfully) renewed
The script simply takes RENEWED_DOMAINS and builds some Line Protocol to indicate what's been renewed, and when
certbot_renewal,domain=all,host=optimus renewed_count=2 1656169934438253518
certbot_renewal,domain=foo.example.com,host=optimus renewed_count=1 1656169934438253518
certbot_renewal,domain=bar.example.xyz,host=optimus renewed_count=1 1656169934438253518
certbot doesn't provide the hook with information about any certificate where renewal failed, but that's not actually an issue. Because we want to catch failure cases where certbot doesn't even fire (perhaps because crond was stopped) we only really want successful renewals as an input signal.
Installing (direct to OS)
If you've got certbot installed directly on the system (as most do), then installation is simple
cd /etc/letsencrypt/renewal-hooks/deploy/
wget https://github.com/bentasker/telegraf-plugins/raw/master/scripts/certbot_renewal_report/certbot_renewal_report.py
chmod +x certbot_renewal_report.py
Installing (docker)
If you run certbot within a docker container (I do this on a handful of systems) you'll need to put the script somewhere so that it's exported into the path /etc/letsencrypt/renewal-hooks/deploy within the container.
For example, my invocation was originally
docker run -it --rm --name certbot \
            -v "/home/dockerfiles/letsencrypt:/etc/letsencrypt" \
            -v "/home/dockerfiles/docroots/letsencrypt:/var/lib/letsencrypt" \
            certbot/certbot -d "$domain" --rsa-key-size 4096 -n --agree-tos --email mymail@example.invalid --webroot -w /var/lib/letsencrypt certonly
So I put a copy of the script into /home/dockerfiles/letsencrypt/renewal-hooks/deploy and made sure it was executable.
Configuring
The easiest way to configure the script is to edit the variables at the top
# Measurement name to use in InfluxDB
measurement = os.getenv("MEASUREMENT", "certbot_renewal")

# System hostname
host = os.getenv("HOSTNAME", os.uname()[1])

# URL to InfluxDB
influx_url = os.getenv("INFLUXDB_URL", "http://127.0.0.1:8086")

# Token, empty or username:password
influx_token = os.getenv("INFLUXDB_TOKEN", "")

# Major version of InfluxDB in use
influx_ver = os.getenv("INFLUXDB_USER", "2") # or 1 for 1.x

# Database/bucket name
influx_bucket = os.getenv("INFLUXDB_BUCKET", "telegraf")
Whilst the script supports pulling the configuration from the environment, I've had mixed success when setting config that way (I haven't dug in yet, but it probably relates to the version of certbot in use).
The next time that certbot renews a certificate it'll push metrics to the InfluxDB instance at INFLUXDB_URL.
It's outside the scope of this documentation, but if you're running telegraf on the system, you could instead point INFLUXDB_URL to telegraf's InfluxDB Listener plugin so that the stats can be buffered and included in larger batches (or even dual-written onto multiple destinations).
Querying
Once there's data in InfluxDB, we can use the following Flux query
query_time = uint(v:now())
from(bucket: "telegraf/autogen")
  |> range(start: -120d)
  |> filter(fn: (r) => r._measurement == "certbot_renewal")
  |> filter(fn: (r) => r._field == "renewed_count")
  |> filter(fn: (r) => r.domain != "all")
  |> last()
  |> map(fn: (r) => ({
     domain: r.domain,
     host: r.host,
     age_days: float(v: (query_time - uint(v:r._time)) / uint(v:1000000000)) / 86400.0
  }))
  |> group()
  |> sort(columns: ["age_days"], desc: true)
To get an at-a-glance overview of certificates and their ages

We can also generate a graph which shows how many certificates have renewed on a given host (useful for spotting when there's a host-wide issue)
from(bucket: "telegraf/autogen")
  |> range(start: -120d)
  |> filter(fn: (r) => r._measurement == "certbot_renewal")
  |> filter(fn: (r) => r._field == "renewed_count")
  |> filter(fn: (r) => r.domain == "all")
  |> group(columns: ["host"])
  |> aggregateWindow(every: 1d, fn: sum, createEmpty: true)
Overdue Certificates
By default, certbot will renew certificates once they're within 30 days of expiry - so we can expect to see a renewal every 60 days, though to allow for a small margin of error, we'll search a slightly longer time period than that (65 days).
There's an obvious caveat here: for this to work, the retention policy on your db/bucket must be at least 65 days long (in my setup, I'm actually querying against downsampled data in a longer lived bucket rather than directly from autogen as I only retain high granularity data for a week).
At first glance, you might think we could run something like this
from(bucket: "telegraf/autogen")
  |> range(start: -65d)
  |> filter(fn: (r) => r._measurement == "certbot_renewal")
  |> filter(fn: (r) => r._field == "renewed_count")
  |> filter(fn: (r) => r.domain != "all")
  |> group(columns: ["domain"])
  |> sum()
and then trigger an alert if the result is < 2 (two being the previous renewal + the one we're checking for). This would work, but would have an annoying side effect: a newly issued certificate would generate alerts until it was first renewed 60 days later.
Clearly, we need to take a slightly different approach
The column renewed_count can be considered an indicator of the current state:
- if
1, the certificate is freshly renewed - if no record then it isn't
A certificate will be in the latter state the majority of the time ("freshly renewed" being a once in 60 days event).
We can use Flux's stateDuration() to calculate how long the certificate has been in that state:
from(bucket: "telegraf/autogen")
  |> range(start: -65d)
  |> filter(fn: (r) => r._measurement == "certbot_renewal")
  |> filter(fn: (r) => r._field == "renewed_count")
  |> filter(fn: (r) => r.domain != "all")
  |> group(columns: ["domain","host"])

  // Create an entry for each day
  |> aggregateWindow(every: 1d, fn: sum, createEmpty: true)

  // Write the value 0 into the empty entries
  |> fill(value: 0.0)

  // Calculate how long since the value was >=1
  |> stateDuration(fn: (r) => r._value < 1, unit: 1d)

  // Take the most recent row
  |> last()
This query returns a table per certificate+host pair with a column called stateDuration indicating how many days since the certificate was last successfully renewed (Note: there must have been a renewal/issuance at some point within our 65 day range for a certificate to appear).
Using this approach, it doesn't matter whether certbot fired and couldn't renew the certificate, or whether it failed to run at all: we're looking for the prolonged absence of a positive report from certbot.
If we want to tabulate certificates of concern into a table in a dashboard, we might add a filter and group to the end
  // Only show certs that haven't been renewed in 61 days
  |> filter(fn: (r) => r.stateDuration >= 61)
  // group into a single output table
  |> group()
But we can also use the main query as the basis for alerting in Kapacitor.
Alerting
We can use Kapacitor's queryFlux node to use our Flux query inside a batch task.
var name = 'Certificate-renewal-check'
var id = name
var crit = 60
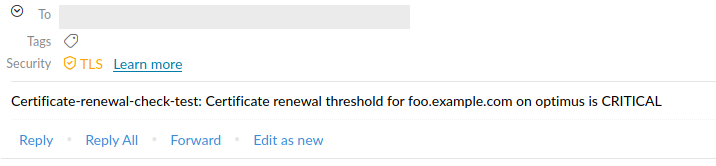
var message = '{{ .ID }}: Certificate renewal threshold for {{ index .Tags "domain" }} on {{ index .Tags "host" }} is {{.Level}}'
var data = batch
|queryFlux('''
from(bucket: "telegraf/autogen")
|> range(start: -65d)
|> filter(fn: (r) => r._measurement == "certbot_renewal")
|> filter(fn: (r) => r._field == "renewed_count")
|> filter(fn: (r) => r.domain != "all")
|> group(columns: ["domain","host"])
|> aggregateWindow(every: 1d, fn: sum, createEmpty: true)
|> fill(value: 0.0)
|> stateDuration(fn: (r) => r._value < 1, unit: 1d)
|> last()
''')
.period(65d)
// Check every 15 minutes (allows for fast recovery emails)
.every(15m)
|eval(lambda: "stateDuration")
.as('value')
var trigger = data
|alert()
.crit(lambda: "value" >= crit)
.message(message)
.id(id)
.idTag('alertID')
.levelTag('level')
.messageField('message')
.durationField('duration')
.details(message)
.stateChangesOnly()
.email()
.to('notifications@example.invalid')
Here, we're using a critical threshold of 61 even though we're targetting 62 days. This is because of the way that the values from stateDuration flow:
- Day of renewal:
-1.00(the predicater._value < 1didn't evaluate true) - Day after renewal:
0.00(the predicate evaluated true, but it hasn't been a full day yet) - Next day:
1.00(yesterday was the first full day)
Therefore, on day 62, the value of stateDuration would be 60.
Note: We could have implemented a similar check using Kapacitor's stateDuration node, but I prefer to have a common query between dashboard graphs and alerting as it reduces the risk of confusion when troubleshooting.
When a domain breaches the threshold, a notification email is sent
And, if a subsequent renewal occurs (because we fixed the issue) we get a recovery email
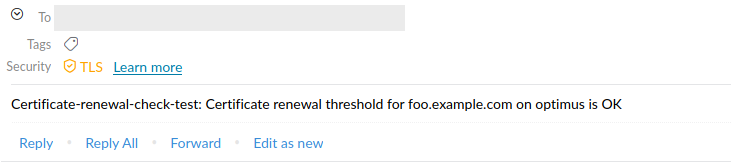
No email will be sent for a certificate that's only just been issued, nor for one which correctly renews within our 62 day threshold.
The recovery email is the reason that we configured the task to run every 15 minutes: it ensures that state is rechecked regularly so that recovery notifications appear within a sensible timeframe. If you're not concerned about that, then the task could instead be configured to run every few hours, or even daily.
Conclusion
We've probably all been burnt, at least once, by certbot failing to renew for some reason.
Traditionally, monitoring might watch for certificates that are within 2 weeks of expiry, but this can be too short for larger deployments or exceptionally busy periods. Even where that's not the case, there's an inherent risk involved in relying on a single health-check, as failures in the check might lead to false negatives.
It's trivial, however, to create and install a certbot hook that'll report every certificate renewal into InfluxDB, allowing alerting via tasks or Kapacitor if a renewal doesn't occur within an expected timeframe.