Set up and monitor a Tor Snowflake Proxy
The Tor Project's Snowflake is a system which helps users in censorious countries gain access to the wider internet (via Tor) despite blocking attempts by local ISPs or Governments. Given current geopolitics, it's unsurprising currently seeing heavy usage from users in both Russia and Iran as citizens seek out non-state-originated information on events affecting those countries.
Snowflake is one of Tor's Pluggable Transports and aims to hide the fact that the user is using Tor by first connecting to an arbitrary endpoint (the Snowflake proxy) as if the user were just browsing the net.
Snowflake's design relies on proxies being run by volunteers: the more there are, the harder it is for governments to block them in order to restrict their citizen's access to information.
This documentation details the process of setting up a standalone Snowflake proxy and using Telegraf to collect basic statistics for monitoring purposes.
Using Snowflake
If you've landed on this page because you're looking for information on how to enable Snowflake, you'll find up-to-date information here.
However, at time of writing, in Tor Browser Bundle, you can do the follow
- Go to
about:preferences#connection - In the Bridges section, click
Select a Built-In Bridge - Enable Snowflake

Click OK
You'll be show bridge details. If you wish to share the bridge details with others, you can either take a copy of the QR code or the Bridge Address.
Other users can choose Add a bridge manually and enter the bridge address.
Base OS
This documentation details the process for Ubuntu, however if you're using another distribution (whether that's Debian, CentOS, Fedora or something different) it's only a couple of install steps which you need to change - links to the relevant instructions are given as and when they occur.
Requirements
You will need
- Somewhere to host the proxy: the only real requirement is that it's on a connection that is not, itself, blocked from accessing Tor. Obviously, the more bandwidth you can offer, the better, so a datacentre location is generally preferable to a home connection
- Optional: InfluxDB (or a free InfluxDB Cloud account) for system monitoring
If you don't have somewhere to host a proxy, but still want to help, there is another way to donate bandwidth - you can also do so from within your browser.
Install Docker
These instructions only differ very slightly from Docker's Ubuntu install instructions - they install docker-compose because that will be required later.
If you're not using Ubuntu, find and follow the relevant Docker Install Instructions, but be sure to include docker-compse.
Add Repos and keys
sudo -s
apt-get update
apt-get -y install \
    ca-certificates \
    curl \
    gnupg \
    lsb-release

mkdir -p /etc/apt/keyrings

curl -fsSL https://download.docker.com/linux/ubuntu/gpg | gpg --dearmor -o /etc/apt/keyrings/docker.gpg

echo \
"deb [arch=$(dpkg --print-architecture) signed-by=/etc/apt/keyrings/docker.gpg] https://download.docker.com/linux/ubuntu \
$(lsb_release -cs) stable" | sudo tee /etc/apt/sources.list.d/docker.list > /dev/null
Update the package indexes and install
sudo -s
apt-get update
apt-get -y install \
docker-ce \
docker-ce-cli \
containerd.io \
docker-compose-plugin \
docker-compose
Run Snowflake
Once the dependencies are installed, running Snowflake really is trivial:
mkdir snowflake/
cd snowflake/
wget https://gitlab.torproject.org/tpo/anti-censorship/docker-snowflake-proxy/raw/main/docker-compose.yml
docker-compose up -d
Monitoring
Unlike the Tor daemon, snowflake doesn't have an endpoint/controlport that can be called to retrieve metrics. It does, however, log some basic stats once an hour (this interval can be changed but doing so is outside the scope of this doc).
We can use a simple Telegraf Exec Plugin to parse these updates and write metrics to InfluxDB for graphing and monitoring purposes.
sudo -s
wget -qO- https://repos.influxdata.com/influxdb.key | tee /etc/apt/trusted.gpg.d/influxdb.asc >/dev/null
source /etc/os-release
echo "deb https://repos.influxdata.com/${ID} ${VERSION_CODENAME} stable" | sudo tee /etc/apt/sources.list.d/influxdb.list
apt-get update && apt-get -y install telegraf
Again, if you're not using Ubuntu, find and follow the relevant Install Instructions.
Give the telegraf user permission to speak to Docker (so that the plugin can retrieve container logs)
sudo usermod -aG docker telegraf
Next we need to fetch and install my snowflake monitoring plugin
sudo mkdir -p /usr/local/src/telegraf_plugins/
cd /usr/local/src/telegraf_plugins/
curl https://raw.githubusercontent.com/bentasker/telegraf-plugins/master/tor-snowflake/tor-snowflake.sh | sudo tee tor-snowflake.sh
sudo chmod +x /usr/local/src/telegraf_plugins/tor-snowflake.sh
If you invoke the script you should get some line protocol back
$ /usr/local/src/telegraf_plugins/tor-snowflake.sh
snowflake,timeperiod_s=3600 conns=38i,sent=236000000i,recv=27000000i 1665913556000000000
snowflake,timeperiod_s=3600 conns=38i,sent=215000000i,recv=66000000i 1665917156000000000
snowflake,timeperiod_s=3600 conns=38i,sent=266000000i,recv=40000000i 1665920756000000000
snowflake,timeperiod_s=3600 conns=46i,sent=160000000i,recv=19000000i 1665924356000000000
Next, Telegraf needs configuring, I've set the following (remember to replace with your details in the output section)
[agent]
  interval = "1m"
  round_interval = true

  metric_batch_size = 1000
  metric_buffer_limit = 10000
  collection_jitter = "0s"

  flush_interval = "10s"
  flush_jitter = "0s"

  precision = ""

  debug = false
  quiet = true

  logfile = ""
  omit_hostname = false

[[inputs.cpu]]
  percpu = true
  totalcpu = true
  collect_cpu_time = false
  report_active = false
[[inputs.disk]]
  ignore_fs = ["tmpfs", "devtmpfs", "devfs", "overlay", "aufs", "squashfs"]

[[inputs.diskio]]
[[inputs.mem]]
[[inputs.net]]
[[inputs.processes]]
[[inputs.swap]]
[[inputs.system]]

[[inputs.docker]]
  endpoint = "unix:///var/run/docker.sock"
  timeout = "5s"
  interval = "5m"

[[inputs.exec]]
    environment = [
        "MEASUREMENT=snowflake",
        "LOG_PERIOD=4h",
        "CONTAINER=snowflake-proxy"
        ]

    commands = [
        "/usr/local/src/telegraf_plugins/tor-snowflake.sh",
    ]
    timeout = "60s"
    interval = "15m"
    name_suffix = ""
    data_format = "influx"


[[outputs.influxdb_v2]]
  urls = ["<my influx url>"]
  token = "<redacted>"
  organization = "<redacted>"
  bucket = "telegraf"
Restart Telegraf
systemctl restart telegraf
This should start writing stats into InfluxDB
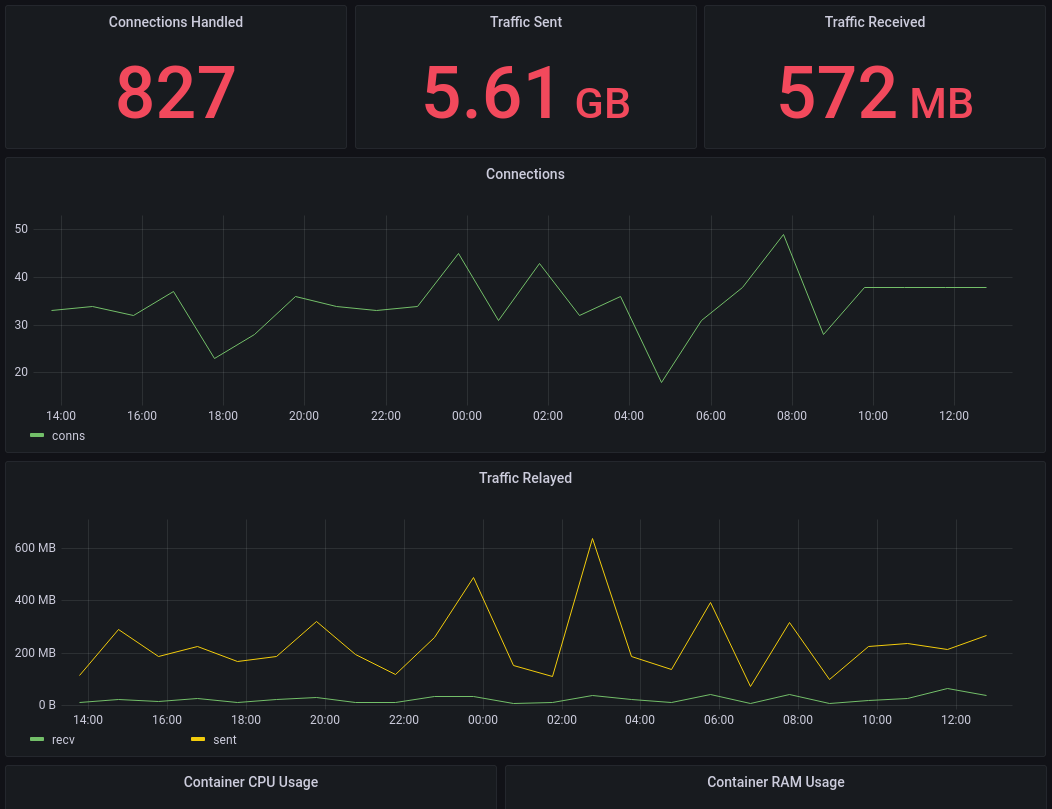
The plugin repo contains an example dashboard for each of
Conclusion
Running a Snowflake proxy is a simple way to help ensure that users in censorious countries can continue to access information. Much like running a Signal Proxy it helps to provide and ensure a means of communication.
Getting Snowflake up and running is incredibly easy. By design, it doesn't log an awful lot of information, so the metrics which can be pulled from it directly are incredibly limited. But, it's periodic updates exposes enough information to verify that it is working.
Telegraf's docker plugin allows us to also collect information on Snowflake's resource usage. Although we haven't in this documentation, it should also be possible to use the netstat input plugin to collect additional information about the state of connections.