Enabling and monitoring the zswap compressed page cache on Linux

I use a Lenovo X1 Carbon for work, and generally speaking it's a lovely bit of kit.
Unfortunately, the laptop was only specced with 16GB of RAM at purchase time, and it turns out that Lenovo decided it was a good idea to solder RAM in, so it's not actually possible to add more.
As a result, I frequently find that I'm using swap.
This isn't as bad as it sounds, the laptop's NVME storage is blazing fast, so it's often not immediately obvious that it's swapping (so much so, in fact, that I set up an ordered set of swap partitions so that it's more obvious when the system is approaching swap exhaustion).
Inevitably though, I reach the point where the system just doesn't have the resources that it needs, especially if I'm busy and multitasking.
The full fix for that, really, is a new laptop but there are things which can be done to mitigate the issue and improve performance a bit.
One of those is enabling a compressed in-memory page cache using the Linux kernel's zswap support (introduced in kernel version 3.11). zswap is more computationally expensive than RAM, but less expensive than swapping to disk.
This post details the process of enabling zswap in order to improve the performance of a Linux system. We'll also explore how to monitor it's usage with Telegraf.
What is zswap?
You might occasionally hear it referred to as "compressed swap".
Whilst technically correct, the name is potentially misleading because we tend to think of swap as being disk based.
However, zswap doesn't change the behaviour of a disk swap file/partition, it's a RAM based storage pool that pages are swapped into first. It sits in between RAM and disk swap, receiving pages that would otherwise have been swapped to disk, compressing and storing them in a dedicated section of memory.
It's a RAM based compressed cache which essentially it trades some memory (for storage) and some CPU cycles (for compression and decompression) to try and avoid incurring the overhead of I/O to a storage device.
If/when the pool reaches it's maximum configured size, zswap LRU's pages out and writes them onward to disk based swap.
Enabling zswap
To enable we need to add a boot time option to the kernel commandline in GRUB's config
Backup the existing config
sudo cp /etc/default/grub /etc/default/grub.bak
Edit the config
sudo nano /etc/default/grub
Append zswap.enabled=1 to the line beginning with GRUB_CMDLINE_LINUX_DEFAULT, giving something like
GRUB_CMDLINE_LINUX_DEFAULT="quiet splash zswap.enabled=1"
Save and exit (ctrl-x, y)
Verify the setting:
$ grep GRUB_CMDLINE_LINUX_DEF /etc/default/grub
GRUB_CMDLINE_LINUX_DEFAULT="quiet splash zswap.enabled=1"
Build the new grub config
sudo update-grub
Reboot the system
sudo reboot
Checking Usage
The kernel provides a few debug statistics which can be used to monitor zswap usage, you'll need root privileges to read the files
-
/sys/kernel/debug/zswap/stored_pages: How many pages are stored -
/sys/kernel/debug/zswap/pool_total_size: Size in memory of stored pages (after compression) -
/sys/kernel/debug/zswap/pool_limit_hit: Has the size limit been reached -
/sys/kernel/debug/zswap/written_back_pages: the number of pages evicted out to disk -
/sys/kernel/debug/zswap/reject_compress_poor: Cumulative counter of pages rejected because they couldn't be compressed sufficiently -
/sys/kernel/debug/zswap/reject_kmemcache_fail: Cumulative counter of pages rejected because memory couldn't be allocated for the pool -
/sys/kernel/debug/zswap/reject_reclaim_fail: Cumulative counter of pages rejected because memory couldn't be reclaimed from the pool to use for storage.
The path /sys/module/zswap/parameters contains information about zswap's configuration:
-
/sys/module/zswap/parameters/accept_threshold_percent: If pool utilisation is over this percentage, refuse to take new pages (prevents flapping) -
/sys/module/zswap/parameters/compressor: the compressor to use,(boot-time optionzswap.compressor) -
/sys/module/zswap/parameters/enabled: Whetherzswapis currently enabled (zswap.enabled) -
/sys/module/zswap/parameters/max_pool_percent: The maximum percentage of RAM that the pool can occupy -
/sys/module/zswap/parameters/same_filled_pages_enabled: Should same-value handling be used to reduce pool storage use where possible? (zswap.same_filled_pages_enabled) -
/sys/module/zswap/parameters/zpool: The zpool type (zswap.zpool)
Monitoring with Telegraf
We can use a simple exec plugin to collect statistics
#!/bin/bash
#
# Capture stats about the kernel's zswap pool
#
# Copyright (c) 2022 B Tasker
#

MEASUREMENT=${MEASUREMENT:-"zswap"}

# Get the zswap config
cd /sys/module/zswap/parameters/

# Tags
config_tags=`grep -H . enabled compressor same_filled_pages_enabled zpool | tr ':' '=' | tr '\n' ','`

# Fields
config_fields=`grep -H . accept_threshold_percent max_pool_percent | tr ':' '=' | tr '\n' ','`

# Get the page size
page_size=`getconf PAGESIZE`

# Get current state
cd /sys/kernel/debug/zswap/

# They're all going to be fields, so do it in a one-liner
state=`grep -H . * | tr ':' '=' | tr '\n' ','`


# Put it all together
echo "$MEASUREMENT,${config_tags%,*} ${state}${config_fields}page_size=$page_size"
A downloadable copy of the script can be found at https://github.com/bentasker/telegraf-plugins/tree/master/zswap.
If we save that to /usr/local/src/zswap.sh we can then configure Telegraf to execute it
[[inputs.exec]]
  commands = ["sudo /usr/local/src/zswap.sh"]
  data_format = "influx"
We need to ensure that telegraf can invoke sudo for this script
echo "telegraf ALL = NOPASSWD: /usr/local/src/zswap.sh" | sudo tee /etc/sudoers.d/telegraf_zswap
Because the script will be invoked automatically with root privileges, we want to make sure that a malicious unprivileged user cannot modify it in order to escalate their own privileges
chmod -w /usr/local/src/zswap.sh
sudo chown root /usr/local/src/zswap.sh
Then restart Telegraf
systemctl restart telegraf
Querying Stats
Once Telegraf's writing the data into InfluxDB it's just a case of running queries to pull out the statistics that we're interested in.
For example, if we're interested in seeing what sort of compression level is being achieved, we need to do a little bit of maths:
   number of pages * page_size
 -------------------------------
          current size
This'll give us the compression ratio. Percentages are easier to graph though, so we divide 1 by the result of that calculation and then multiply by 100.
(1 / (( number of pages * page_size ) / current size)) * 100
We can do this in Flux as follows
from(bucket: "telegraf/autogen")
  |> range(start: -12h)
  |> filter(fn: (r) => r._measurement == "zswap")
  |> filter(fn: (r) => contains(value: r._field,
  set: ["page_size","stored_pages", "pool_total_size"])
  )
  |> filter(fn: (r) => r.host == "bumblebee")
  |> pivot(rowKey: ["_time"],
           columnKey: ["_field"],
           valueColumn: "_value")

  // Use map to calculate compression ratio and
  // convert to a percentage
  //
  |> map(fn: (r) => ({
     _time: r._time,
     _field: "compression_rate",
     _value: if r.pool_total_size > 0.0 then
        (1.0 / ((r.page_size * r.stored_pages) / r.pool_total_size)) * 100.0
     else
       // Avoid div-by-0
       0.0
  }))
  |> aggregateWindow(every: 5m, fn: max)
Which allows us to graph out the pool's efficiency
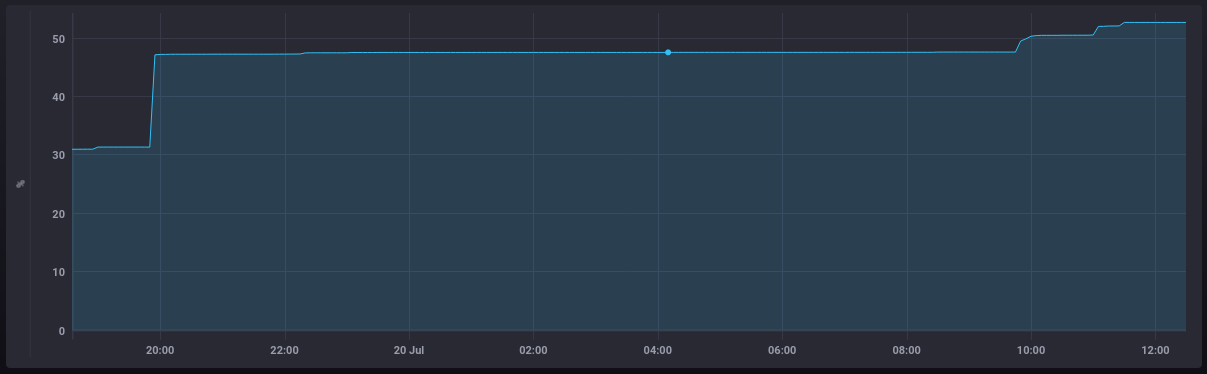
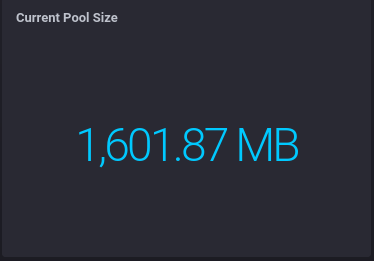
We can use part of that earlier calculation to show the current size of the zswap pool in MB
from(bucket: "telegraf/autogen")
  |> range(start: -12h)
  |> filter(fn: (r) => r._measurement == "zswap")
  |> filter(fn: (r) => r._field == "stored_pages" or r._field == "page_size")
  |> filter(fn: (r) => r.host == "bumblebee")
  |> pivot(rowKey: ["_time"],
           columnKey: ["_field"],
           valueColumn: "_value")
  |> last()
  |> map(fn: (r) => ({ r with
    _value: (r.page_size * r.stored_pages) / 1024.0 / 1024.0
  }))
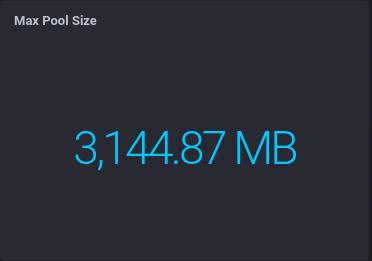
The kernel only exposes the maximum pool size as a percentage of total RAM, so if we want the value in bytes we need to pull data from the memory measurement and use that in our calculation
perc = from(bucket: "telegraf/autogen")
  |> range(start: -12h)
  |> filter(fn: (r) => r._measurement == "zswap")
  |> filter(fn: (r) => r._field == "max_pool_percent")
  |> filter(fn: (r) => r.host == "bumblebee")
  |> last()

// Get the total memory
mem = from(bucket: "telegraf/autogen")
  |> range(start: -12h)
  |> filter(fn: (r) => r._measurement == "mem")
  |> filter(fn: (r) => r._field == "total")
  |> filter(fn: (r) => r.host == "bumblebee")
  |> last()
  |> toFloat()

// Put them together and do maths
union(tables: [perc, mem])
  |> group()
  |> pivot(rowKey: ["_stop"], columnKey: ["_field"], valueColumn: "_value")
  |> map(fn: (r) => ({
     _value: ((r.total / 100.0) * r.max_pool_percent) / 1024.0 / 1024.0
  }))
These queries can be used to put together a dashboard showing zswap utilisation and reject rates
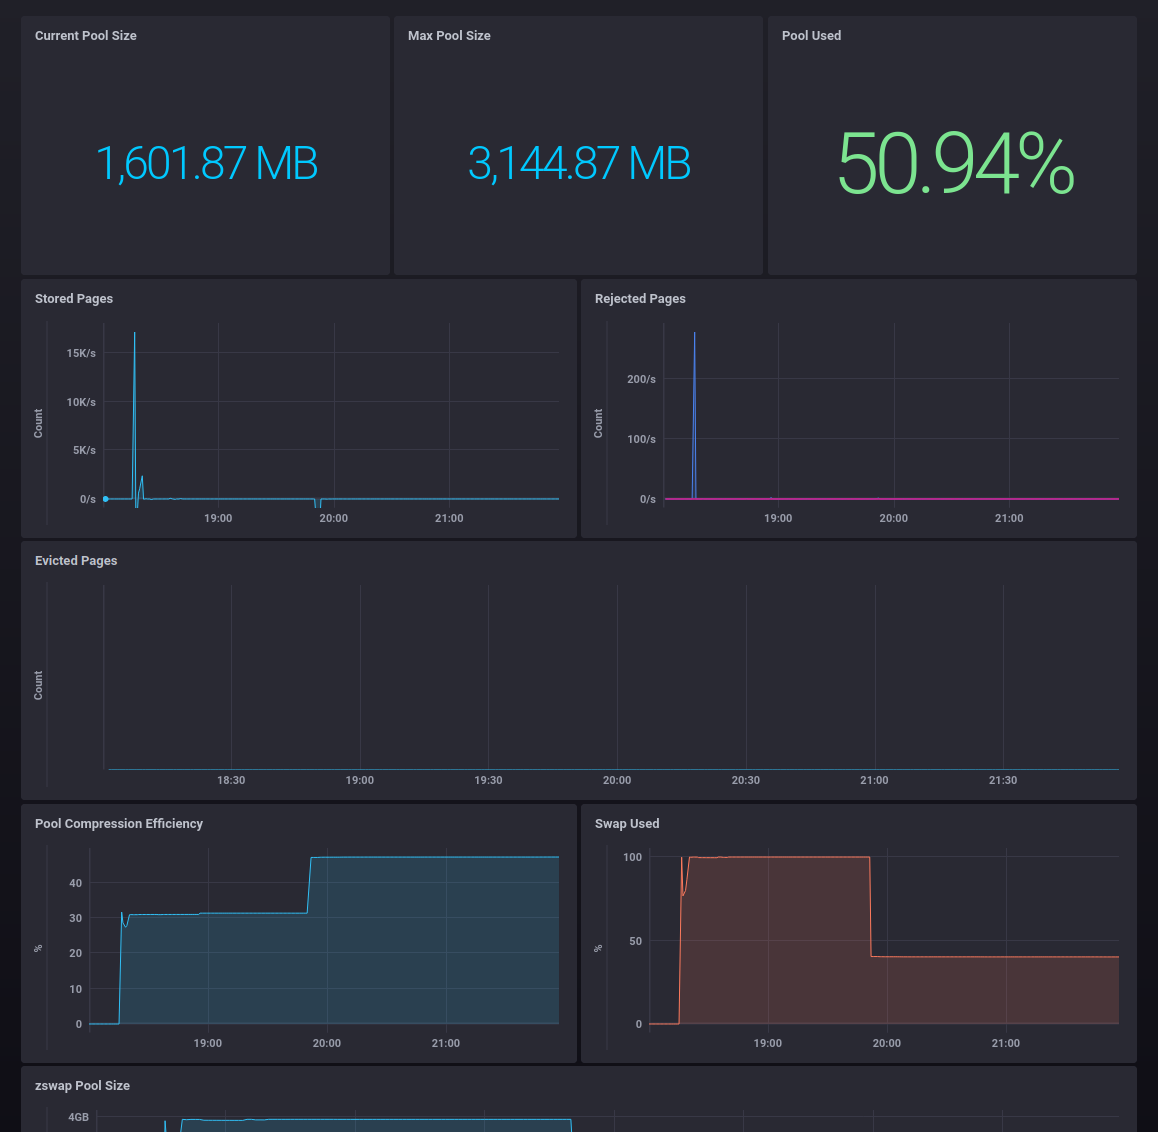
If you're using Chronograf, there's an export of this dashboard available here.