The Effectiveness Of SSH Tarpits
About 18 months ago, I wrote and deployed a SSH Tarpit which works on exactly the same basis as endlessh.
Just like a normal SSH daemon, the tarpit listens on tcp/22. Once a client connects, it sends an endless stream of characters as the SSH banner, inserting a random sleep between each chunk in order to reduce resource/bandwidth demand on the server.
// Calculate a length for the string we should output
strlength = rand.Intn(MAX_LENGTH - MIN_LENGTH) + MIN_LENGTH

// Generate the string
randstr = genString(strlength)

// Write it to the socket
_, err := conn.Write([]byte(randstr + "\r\n"))

/* Sleep for a period before sending the next
    * We vary the period a bit to tie the client up for varying amounts of time
*/
delay = time.Duration(rand.Intn(MAX_SLEEP - MIN_SLEEP) + MIN_SLEEP)
time.Sleep(delay * time.Second)
The idea being that the client will bog down waiting on a SSH connection that will never actually be usable, rather than simply moving on to bug someone else.
About a week after deploying the tarpit, I pulled some stats and did some basic (but messy) analysis on the tarpit's activities.
I recently needed to re-deploy a tarpit, because of a failure in the underlying hardware. Whilst doing so, I also made changes so that statistics would be written into InfluxDB for later analysis.
The aim of this post is to explore how behaviour observed in the tarpit has changed since January 2021 as well as to try and assess whether tarpits are still effective enough to be worth running.
Identifying Improved Bots
Tarpits are not, by any stretch of the imagination, a new concept.
So, you would expect that most modern bots are written with tarpits in mind, reducing the overall effectiveness of tarpitting.
There's generally no way for a bot to know in advance that a given SSH server is a tarpit, so there shouldn't be any real reduction in the number of bots falling into the tarpit.
What we should see, though, is that bots escape much more quickly (as the result of conservative timeout settings) than they did previously.
Whether there'll be a dramatic difference in the space of 18 months, however, isn't clear - tarpits weren't exactly a new concept then either.
Examining Tarpit Durations
In January 2021, I examined 7265 full tarpit events (a "full" event being one where the client has both entered and exited - generating two loglines) that had been recorded over a period of 8 days.
As part of that analysis, I sorted by duration and captured the 1000 longest events:
$ grep Coward tarpit_log.log | sort -n -k 6 | tail -n 1000 | head -n1 | grep -o -P "[0-9]+ sec"
3085 sec

$ grep Coward tarpit_log.log | sort -n -k 6 | tail -n 1000 | tail -n1 | grep -o -P "[0-9]+ sec"
41456 sec
So, in 2021, 14% (1000/7265) of tarpitted connections in the sample were stuck for a minimum of 51 minutes.
Selecting the top 1000 is quite limited as a methodoloy, but as we want a like-for-like comparison we'll stick with it for the time being.
We can use Flux to pull the same stats from 2022's dataset:
data = from(bucket: "telegraf/autogen")
  |> range(start: 2022-07-08T10:57:54Z, stop: 2022-07-16T10:57:54Z)
  |> filter(fn: (r) => r._measurement == "ssh_tarpit")
  |> filter(fn: (r) => r._field == "after")
  |> group()

// How many connections were recorded?
tot = data
       |> count()
       |> map(fn: (r) => ({r with
           _value: float(v: r._value),
           _field: "total"
           }))

// Filter the top 1000
top = data
       |> top(n: 1000)

// get the stats
max = top
       |> max()
       |> map(fn: (r) => ({r with
           _field: "max"
           }))

min = top
       |> min()
       |> map(fn: (r) => ({r with
           _field: "min"
           }))

// Put them together for display
union(tables: [tot, max, min])
       |> pivot(rowKey: ["_start"],
             columnKey: ["_field"],
             valueColumn: "_value"
             )
Running this query tells us the total number of connections recorded, the 1000th and 1st longest time spent in the tarpit.
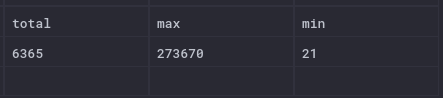
This is a markedly different result to 2021's observations
| Year | Shortest | Longest |
|---|---|---|
| 2021 | 3085 | 41456 |
| 2022 | 21 | 273670 |
The 1000th longest duration was just 21 seconds.
Although the longest stick was an impressive 76 hours, it's not particularly indicative: it only takes one badly configured bot to push the maximum higher, so there's an element of luck around when the sample is taken.
Sticking with direct comparison for now, if we take 2021's minimum figure of 51 minutes, what percentage of connections in the 2022 sample were stuck for at least that long?
threshold = 3085.0

from(bucket: "telegraf/autogen")
  |> range(start: 2022-07-08T10:57:54Z, stop: 2022-07-16T10:57:54Z)
  |> filter(fn: (r) => r._measurement == "ssh_tarpit")
  |> filter(fn: (r) => r._field == "after")
  // Filter out results that didn't spend long enough
  |> filter(fn: (r) => r._value >= threshold)
  |> group()
  |> count()
  |> map(fn: (r) => ({ r with
        // What percentage of conns?
        _value: (float(v: r._value) / 6365.0) * 100.0
  }))
Just 0.72% of tarpitted connections remained stuck for at least 51 minutes, a long way short of the 14% observed in 2021.
As noted above though, the use of top-1000 (and by extension the 51 minute figure) isn't particularly useful, so let's move on from that.
We want to know what the percentage distribution is for various values of stick time.
To get this, we just adjust the threshold in the query above in order to get each period's percentage shares.
| Stick Time | Percentage |
|---|---|
| 30m | 0.9% |
| 15m | 3.49% |
| 5m | 5.59% |
| 2m | 6.50% |
| 1m | 8.86% |
| 45s | 9.69% |
| 30s | 11.44% |
| 20s | 21.19% |
| 15s | 36.92% |
| 12s | 47.53% |
| 10s | 55.30% |
| 5s | 86.91% |
| 2s | 99.78% |
So, the majority of bots remained in the tarpit for less than 12 seconds (the 50% mark sits at 11.something seconds).
This would certainly seem to support the idea that tarpits are becoming less effective:
- In 2022 the vast majority of bots stuck for less than
15 seconds. - In 2021,
14%of connections stuck for51 minutes, in 2022 the14%threshold falls at less than half that
Country Distribution
The analysis in 2021 showed that behaviour varied quite significantly between different countries of origin, so the effectiveness of a tarpit is also partially dependant on which countries are most commonly connecting into it.
In 2021, the distribution of the top 10 countries of origin by connection rate was
| Country | Percentage |
|---|---|
| VN | 21.7% |
| CN | 11.13% |
| BR | 9.96% |
| IN | 9.81% |
| TH | 8.08% |
| ID | 6.95% |
| RU | 2.99% |
| GB | 2.93% |
| US | 2.77% |
| DE | 2.08% |
If we query the same stats for 2022
from(bucket: "telegraf/autogen")
  |> range(start: 2022-07-08T10:57:54Z, stop: 2022-07-16T10:57:54Z)
  |> filter(fn: (r) => r._measurement == "ssh_tarpit")
  |> filter(fn: (r) => r._field == "after")
  |> group(columns: ["country"])
  |> count()
  |> map(fn: (r) => ({ r with
        // What percentage of conns?
        _value: (float(v: r._value) / 6365.0) * 100.0
  }))
  |> group()
  |> top(n: 10)
We see that there's been a fairly dramatic shift in distribution
| Country | Percentage |
|---|---|
| US | 13.48% |
| RU | 10.97% |
| CN | 9.25% |
| JP | 8.11% |
| LT | 4.60% |
| NL | 2.99% |
| TW | 2.88% |
| KR | 2.16% |
| VN | 1.98% |
| SG | 0.58% |
Although Vietnam was the top source in 2021, it now accounts for just 1.98% of tarpitted connections.
Russia's rise in the statistics probably isn't overly surprising given Russia's invasion of Ukraine, and the associated rise in activity from Russian aligned cybercrime groups.
Per-Country Effectiveness
So, we can see where connections are most likely to originate from, but we also need to assess which countries are most prone to long-lived connections (i.e. which countries are likely to be tarpitted for the longest periods).
In 2021 I checked using a threshold of 60 seconds, so we'll use that to make comparison easy
threshold = 60.0

from(bucket: "telegraf/autogen")
  |> range(start: 2022-07-08T10:57:54Z, stop: 2022-07-16T10:57:54Z)
  |> filter(fn: (r) => r._measurement == "ssh_tarpit")
  |> filter(fn: (r) => r._field == "after")
  |> filter(fn: (r) => exists r.country)
  |> group(columns: ["country"])
  |> filter(fn: (r) => r._value >= threshold)
  |> count()
  |> map(fn: (r) => ({ r with
        // What percentage of conns?
        _value: (float(v: r._value) / 6365.0) * 100.0
  }))
  |> group()
  |> top(n: 5)
| Position | 2021 | 2022 | ||
|---|---|---|---|---|
| 1 | CN | 10.64% | CN | 4.95% |
| 2 | TH | 0.18% | VN | 1.29% |
| 3 | US | 0.15% | RU | 0.39% |
| 4 | RU | 0.14% | US | 0.17% |
| 5 | VN | 0.11% | ZA | 0.09% |
China has maintained it's position at the top of the table, but a far smaller proportion of connections stick for a least 60s than did in 2021.
So, although we're 1.4x more likely to see a connection from the US than from China, it's significantly less likely that the US connection will stick around for more than 60 seconds.
If we adjust the query to look at the distribution of those who were tied up most effectively - for 15 minutes or more - then the rankings shift a bit
| Position | 2022 | % |
|---|---|---|
| 1 | CN | 2.22 |
| 2 | RU | 0.39 |
| 3 | ZA | 0.09 |
| 4 | US | 0.06 |
| 5 | VN | 0.03 |
However, there's an issue with these statistics.
They represent the percentage of total connections, so there's a natural bias towards countries that connect in more regularly.
It's more interesting to look at what percentage of connections from that country were tarpitted most effectively.
data = from(bucket: "telegraf/autogen")
  |> range(start: 2022-07-08T10:57:54Z, stop: 2022-07-16T10:57:54Z)
  |> filter(fn: (r) => r._measurement == "ssh_tarpit")
  |> filter(fn: (r) => r._field == "after")
  |> filter(fn: (r) => exists r.country)
  |> filter(fn: (r) => contains(
                    value: r.country,
                    set: ["ZA", "CN","RU", "US", "VN"])
                        )
  |> group(columns: ["country"])


tot_count = data
          |> count()
          |> rename(columns: {_value: "total"})

long_counts = data
          |> filter(fn: (r) => r._value >= 900.0)
          |> count()
          |> rename(columns: {_value: "long"})
| Country | % |
|---|---|
| ZA | 100.00% |
| CN | 23.94% |
| RU | 3.58% |
| US | 0.05 |
| VN | 1.59 |
South Africa wins, hands down.
In practice, ZA accounted for very few connections (6) but every single one of them remained in the tarpit for at least 15 minutes. With so few connections, it's probably to fair to say that this is anomalous and likely caused by a single poorly configured bot.
China though, as we've seen, accounts for a reasonable proportion of connections and nearly a quarter of China originated connections end up stuck in the tarpit for at least 15 minutes.
Overall Time Burnt
Trapping individual bots for a long time delivers a dopamine hit, but it's not the only measure of effectiveness.
Every second spent in the tarpit is a second that's not being used elsewhere, so even shorter periods represent the delivery of some small level of inconvenience.
With that in mind, it's worth looking at how much bot time we've wasted overall:
from(bucket: "telegraf/autogen")
  |> range(start: 2022-07-08T10:57:54Z, stop: 2022-07-16T10:57:54Z)
  |> filter(fn: (r) => r._measurement == "ssh_tarpit")
  |> filter(fn: (r) => r._field == "after")
  |> group()
  |> sum()

In the past 8 days, bots have collectively had 20.14 days of time wasted: 2.5 days every IRL day.
System Resource Usage
We've inconvenienced bots, overall, for more wall-clock time than we've spent, but at what cost to ourselves? After all, any assessment of whether tarpitting is an effective use of resources depends heavily on what resources we're using.
The tarpit runs inside a docker container, which is monitored with telegraf so it's pretty straight forward to check
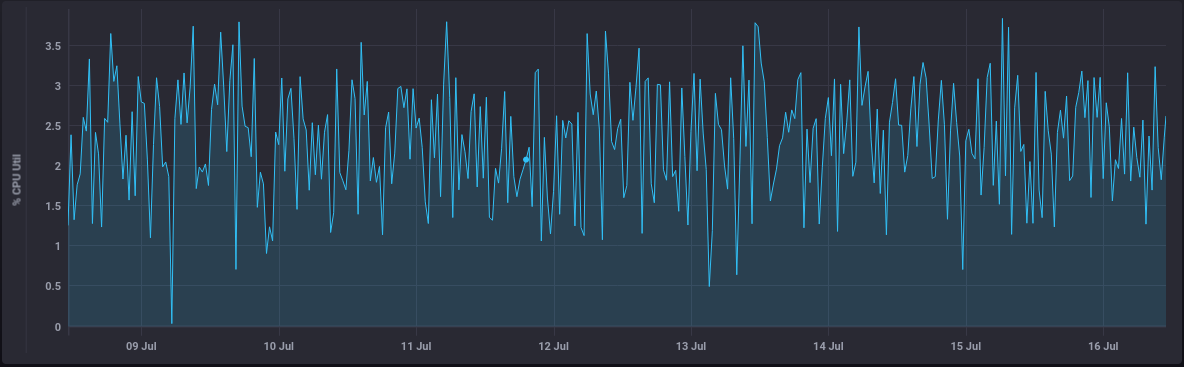
CPU Usage is consistently low
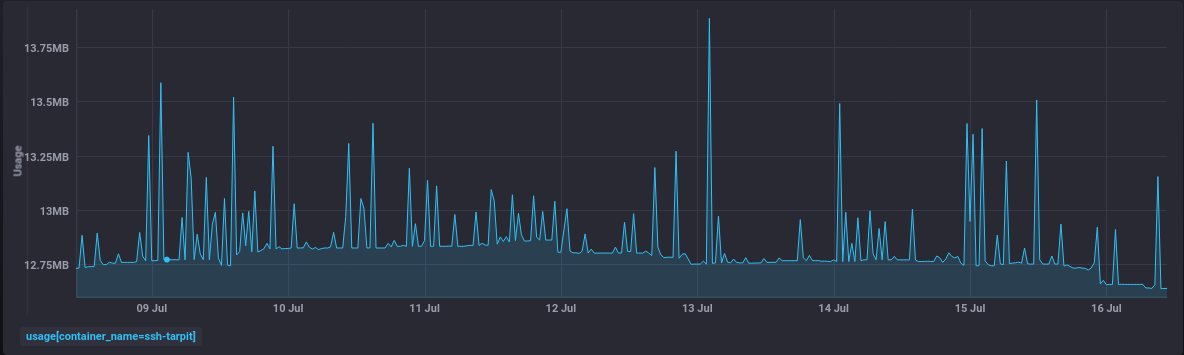
Memory consumption is the same, baselining at about a tenth of the RAM that a Google Chrome instance habitually consumes.
Network usage is relatively low (the benefit of those sleeps) peaking at about 2Kbps
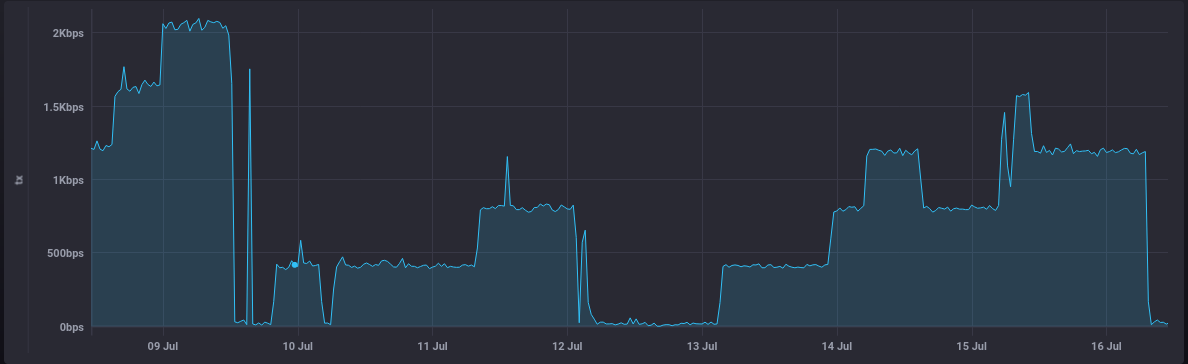
The container's network counter is an incremental one, so by subtracting the first reading from the last we can see that 498 MB was transmitted onto the network during those 8 days.
Overall then, the resource cost of running the tarpit really is quite low.
Confounding Variables
Of course, there are a number of factors that might have influenced results:
- My main tarpit host has been running for quite a while and might have been blacklisted by some bot operators.
- The stats are only generated by examining a single week - the picture may vary with a longer or different sample.
- As noted above, Russian activity may currently be higher as a result of activities around their ongoing attempt to invade Ukraine.
- The country of origin statistics are generated based on the only information we have (the IP) - so it tells us where the bot is likely to be (VPNs and Tor not-withstanding) and not where the operator is.
- Statistics on stick time are calculated when a client gives up, so there may be some extremely long lived connections active in the pit that aren't represented in the stats.
- The tarpit could trivially be adjusted to send fewer bytes to reduce network usage, so resource usage could be lower than it is currently
Conclusion
These stats allow us to make a few fairly broad statements
- You're currently most likely to see SSH bot activity originating from the US or Russia
- Tarpits are most effective against Chinese bots (with the anomalous exception of some South African connections)
- Bots do generally seem to be better configured overall, with short timeouts set, than they were 18 months ago
In 2021 the most common point of origin was Vietnam, but they've slipped all the way down the rankings to number 9.
Although bots get stuck for shorter periods on average, the total amount of bot time wasted remains fairly high.
The overall effectiveness of a tarpit, however, clearly depends on which countries are most active at any given time. Bots in China are statisically more likely to be trapped effectively than those originating from the US or Russia, so tarpits are a little less effective whilst those two countries dominate the annoyance charts.
But, given that the resource cost of running a tarpit is negligible, delivering a little bit of inconvenience to bot operators continues to feel worthwhile.
Of course, sod's law must have it's say: having run all the statistics and finished the first drafts of this post, I check the stats only to find that a Russian connection decided that it would not be outdone by the stick time that other countries achieved:

That's a little over 9 days spent in the tarpit.