Implementing Webmention statistics and moderation with Telegraf, InfluxDB and Kapacitor
I recently added webmention support to my site so that webmentions are sent for content that I've linked to (if the other end supports it), as well as displaying webmentions alongside content that's been mentioned elsewhere.
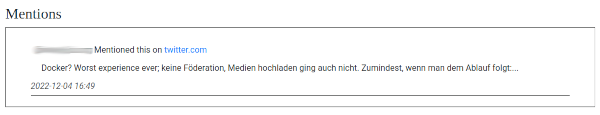
As part of setting the site up to display mentions, I implemented a basic moderation mechanism, allowing me to easily prevent display of problematic mentions.
However, as I noted, the mechanism is inherently reactive: mentions are automatically embedded into pages, so any moderation happens after the mention has been available (potentially for quite some time).
My initial thinking was that addressing this would mean creating some kind of UI and notification system (so that new mentions could be received and reviewed before being approved for display). Doable, but very much on the "I'll get around to it" list.
In the meantime, though, I wanted to be able to collect some basic statistics:
- when webmentions are received
- where they're made
- which page has been mentioned
Whilst thinking about how best to capture and record this data, it occurred to me that the same flow could actually be used to send notifications of webmentions, allowing more proactive (if technically still re-active) moderation.
In this post I'll describe how I built a simple workflow using Telegraf, InfluxDB and Kapacitor to retrieve webmentions, send alerts and generate aggregate statistics.
Collecting WebMentions
Mentions relating to my sites are sent to Webmention.io which has a well developed and easy to use API. The API includes a means to fetch all webmentions for a given domain.
It also allows retrieval of mentions within arbitrary time-ranges, so rather than retrieving a (hopefully) ever increasing data-set, it's possible to instead fetch all mentions made in the last 30 minutes or so.
To do so, we just need to construct a request like the following
curl "https://webmention.io/api/mentions.jf2?token=${token}&since=${date_rfc3339}"
This then returns JSON detailing any matching webmentions.
I wrote a Telegraf exec Plugin to automate the process.
Database
The plugin doesn't generate aggregate stats and instead converts each mention into Line Protocol:
webmentions,type=in-reply-to,url=http://example.invalid/foo.html,author=Ben,domain=example.invalid,srcdomain=anotherexample.invalid, id=1582037,author_url="",linked_from="https://anotherexample.invalid/bar.html",content="foo bar sed" 1671062400000000000
This allows detailed notifications to be sent about new mentions, but also means that the data is potentially very high cardinality (because there's a series per user, domain and mention type).
Taking twitter.com as an easy example, we might end up with the following series
webmentions,type=in-reply-to,url=somewhere.html,author=@bentasker,domain=example.invalid,srcdomain=twitter.com,
webmentions,type=in-reply-to,url=somewhere.html,author=@someone,domain=example.invalid,srcdomain=twitter.com,
webmentions,type=in-reply-to,url=somewhere.html,author=@someoneoneelse,domain=example.invalid,srcdomain=twitter.com,
Once notifications have been sent, though, we'll only need aggregate statistics (which also tend to be lower cardinality).
So, the raw data is written into a dedicated database (called webmentions) and alerts/notifications will be generated from there, before the data is periodically downsampled into the longer-lived database.
In order to achieve this, Telegraf's tagpass is used to control which database receives these writes
[[inputs.exec]]
  commands = [
    "/usr/local/src/telegraf_plugins/webmention_io.py",
  ]
  timeout = "60s"
  interval = "15m"
  name_suffix = ""
  data_format = "influx"


# Main Output
[[outputs.influxdb]]
  urls = ["http://192.168.13.184:8086"]
  database = "telegraf"
  [outputs.influxdb.tagdrop]
    influxdb_database = ["*"]

# Webmentions output
[[outputs.influxdb]]
  urls = ["http://192.168.13.184:8086"]
  database = "webmentions"
  # drop the routing tag
  tagexclude = ["influxdb_database"]
  [outputs.influxdb.tagpass]
    influxdb_database = ["webmentions"]
This ensures that the other stats being collected by Telegraf continue to be sent to the telegraf database, whilst the new datasource is routed to the dedicated webmentions bucket.
Notifications
There are a number of possible ways to have new points result in a notification. I use Kapacitor for a lot of my alerting needs, so it made sense to go with that.
The "alert" criteria is fairly simple: if points exist within the timerange, an email should be sent for each.
I implemented this with the following TICKscript
var id = 'Webmention ID {{ index .Tags "id" }}'

var message = 'New Webmention for {{ index .Tags "domain" }} on {{ index .Tags "srcdomain"}}'

var details = '''New Webmention for {{ index .Tags "domain" }} on {{ index .Tags "srcdomain"}}.
<br /><br />
Webmention id: {{ index .Fields "id"}} <br />
Author: {{ index .Tags "author" }} ({{ index .Fields "author_url" }}) <br />
Link: {{ index .Fields "linked_from" }} <br />
References: {{ index .Tags "url" }} <br />

Content:
<br />
{{ index .Fields "content" }}

'''

var data = batch
    |queryFlux('''
    from(bucket: "webmentions")
        |> range(start: -6h)
        |> pivot(rowKey: ["_time"], columnKey: ["_field"], valueColumn: "_value")
        // I've been a muppet and passed this in as a float
        // caste to int to prevent printing with an exponent
        |> map(fn: (r) => ({r with id: int(v: r.id)}))
      ''')
        .period(6h)
        .every(6h)
    |log()
    |alert()
        .warn(lambda: isPresent("domain"))
        .message(message)
        .id(id)
        .idTag('alertID')
        .levelTag('level')
        .messageField('message')
        .durationField('duration')
        .details(details)
        .email()
        .to(<my alerts mail>)
This runs a Flux query every 6 hours to retrieve points (pivoting so that all fields are available for use), and then sending an alert email:
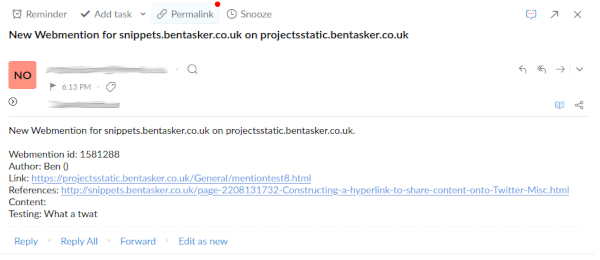
The notification (in theory) has everything I need to review a mention. If I decide that it's something I don't want to display, I just need to add the ID to the site's blocklist.
The script runs every 6 hours because Brid.gy polls linked social media accounts every 4 hours. With lower task run intervals, I was missing notifications because Brid.gy sourced mentions were being inserted outside of the timerange queried by the next task run. I added an error margin of a couple of hours to allow for delays.
There are more graceful ways to address the problem, but as I don't actually care if the notifications take a while to arrive, it was the simplest way to address this.
With the task live, notifications started arriving for mentions.
Downsampling
Once it's been used to trigger notifications, the full granularity data is no longer required.
A Flux task is used to downsample into aggregate stats
option task = {
    name: "downsample_webmention_raw_stats",
    every: 15m,
    offset: 1m,
    concurrency: 1,
}

in_bucket = "webmentions"
out_bucket = "telegraf/autogen"
host="http://192.168.13.184:8086"
token=""
window_period = 5m


sourcedata = from(bucket: in_bucket, host: host, token: token)
    |> range(start: -1h)
    |> filter(fn: (r) => r._measurement == "webmentions")
    |> filter(fn: (r) => r._field == "id")

// Mention counts
sourcedata
    // Drop the source username from the group key
    |> group(columns: ["_measurement", "type", "url", "domain", "srcdomain"])
    |> aggregateWindow(every: window_period, fn: count, createEmpty: false)
    |> set(key: "_field", value: "mentions")
    |> drop(columns: ["_start", "_stop"])
    |> to(bucket: out_bucket, host: host, token: token)

// Calculate number of unique authors
sourcedata
    |> window(every: window_period)
    |> group(columns: ["_measurement", "type", "url", "domain", "srcdomain", "author"])
    |> map(fn: (r) => ({r with _value: 1}))
    |> group(columns: ["_measurement", "type", "url", "domain", "srcdomain"])
    |> aggregateWindow(every: window_period, fn: sum, createEmpty: false)
    |> drop(columns: ["_start", "_stop"])
    |> set(key: "_field", value: "num_authors")
    |> to(bucket: out_bucket, host: host, token: token)
This rolls the data up into two fields
mentionsnum_authors
With the value of each representing counts for each 5 minute period.
Crucially, the source username is dropped from the series, significantly reducing cardinality (because there's no longer one series per user/domain)
This means that our earlier example becomes a single series
webmentions,type=in-reply-to,url=somewhere.html,domain=example.invalid,srcdomain=twitter.com
There is still some potential for high cardinality, however, as we continue to seperate series by mention type as well as which page was mentioned and the mentioning domain. This, though, is still a much smaller range of series than possible with usernames/handles as an additional differentiator.
Graph
Aggregate stats can then trivially be graphed out in dashboards
// Display webmention counts, grouped by type and domain
from(bucket: "webmentions")
    |> range(start: v.timeRangeStart, stop: v.timeRangeStop)
    |> filter(fn: (r) => r._measurement == "webmentions")
    |> filter(fn: (r) => r._field == "mentions")
    |> group(columns: ["type", "domain"])
    |> aggregateWindow(every: v.windowPeriod, fn: sum)

The use of v.windowPeriod ensures that data is grouped into windows appropriate to the queried timerange, so if we query a 6 month period we're not going to try and render a graph with a datapoint every 5 minutes.
Because of the downsampling we performed earlier, we can no longer graph out by author (this is a good thing, as it respects the privacy of others), but we can graph out a count of unique authors per sample period
from(bucket: "webmentions")
    |> range(start: v.timeRangeStart, stop: v.timeRangeStop)
    |> filter(fn: (r) => r._measurement == "webmentions")
    |> filter(fn: (r) => r._field == "num_authors")
    |> group(columns: ["type"])
    |> aggregateWindow(every: v.windowPeriod, fn: sum)

And, of course we can generate a graph of the pages being linked to
from(bucket: "websites/analytics")
    |> range(start: v.timeRangeStart, stop: v.timeRangeStop)
    |> filter(fn: (r) => r._measurement == "webmentions")
    |> filter(fn: (r) => r._field == "mentions")
    |> group(columns: ["url"])
    |> aggregateWindow(every: v.windowPeriod, fn: sum)

Along with where mentions are being made
from(bucket: "websites/analytics")
    |> range(start: v.timeRangeStart, stop: v.timeRangeStop)
    |> filter(fn: (r) => r._measurement == "webmentions")
    |> filter(fn: (r) => r._field == "mentions")
    |> group(columns: ["url"])
    |> aggregateWindow(every: v.windowPeriod, fn: sum)

Conclusion
With just a little bit of setup, it's possible to have Telegraf retrieve mentions from webmention.io in order to allow a basic notification and moderation flow.
As part of that, aggregate statistics can be generated showing the frequency of mentions and where they're arriving from. Whilst these stats are more interesting than they are operationally significant, they do (or will) help give a view into the sources of unexpected traffic sites, as well as which topical content later gets referenced.