Monitoring a Mastodon Instance with Telegraf

I recently published a post detailing how to stand up a Mastodon server using docker-compose.
For those with an operations bent though, that post misses a key component (even if it is alluded to): monitoring. If you're standing up public facing services, you almost certainly want automated monitoring (and alerting) to help ensure that someone's told if services aren't running properly.
Mastodon's administration interface exposes a wide range of useful statistics, but the presentation is very much reliant on the server operator manually checking in. As a result, the interface is great for troubleshooting, but not so helpful for service assurance purposes.
In this post, I'll describe how to use Telegraf to collect stats from the service's underlying components, and write them into InfluxDB allowing graphing and alerting. Telegraf supports writing to other output databases, so the Telegraf setup section of the process may still be relevant even if you use a different TSDB (or you can register for a free InfluxDB Cloud account).
Although the steps are based on the deployment generated by using docker-compose, it should be relatively easy to translate configs to connect to natively installed services instead, and I've tried to provide hints on how to do that.
Contents
- Assumptions
- Metrics to collect
- Telegraf Install
- Telegraf Configuration
- Adjusting
docker-compose.yml - Graphing
- Alerting
- Useful Information
- Conclusion
Assumptions
The primary assumption in this document is that you've used a variation of the provided docker-compose.yml as described here.
Hints are given on what needs to be changed if this assumption isn't true, but they're fairly simplistic (for example, if you're comfortable exporting environment vars for a service to use, a lot of replacements can be avoided) and can definitely be improved upon.
The container names used in Telegraf's config (and subsequent queries) are drawn from the docker-compose.yml file, so if you've changed service names, you'll need to remember to account for that.
It also assumes you have InfluxDB (or your desired database) up and running already .
What we'll monitor
Mastodon is underpinned by a number of services
- The web worker
- The streaming worker
- Sidekiq
- Redis
- PostgreSQL
We are going to collect statistics directly from each of these, as well as using basic HTTP and TLS probes to collect status codes and TLS certificate information.
Install Telegraf
The steps in this document use Telegraf's docker image, so grab a copy of that
docker pull telegraf:latest
If you'd prefer a bare-metal install, follow the Installation Instructions for your platform.
If you're mixing and matching (running telegraf in docker, with services installed natively), you'll need to run the telegraf container with --net=host so that Telegraf can access the host's loopback interface.
Configure Telegraf
If you're doing a bare-metal install, there are a few things that you'll need to change, so we'll walk through the config section by section.
If you want to cheat, you can grab a copy of the config from https://github.com/bentasker/grafana_dashboards/blob/master/mastodon/telegraf.conf.
Create a text file called telegraf.conf
vi telegraf.conf
Add each of the following sections to it, observing notes as necessary.
Agent config:
# If you're installing on bare-metal
# remove the hostname line below
[agent]
  interval = "1m"
  round_interval = true
  metric_batch_size = 1000
  metric_buffer_limit = 10000
  collection_jitter = "0s"
  flush_interval = "10s"
  flush_jitter = "0s"
  precision = ""
  debug = false
  quiet = true
  logfile = ""
  hostname = "$REPORTED_HOSTNAME"
  omit_hostname = false
Redis and Sidekiq information collection:
# If you're installed on baremetal, you'll probably want to
# change the hostname in servers to be 127.0.0.1
# or the hostname/ip of your redis server (if seperate)

# Monitor redis
# AND retrieve the sidekiq stats from it
[[inputs.redis]]
  servers = ["tcp://redis:6379"]

  [[inputs.redis.commands]]
      command = ["get", "stat:processed"]
      field = "sidekiq_stat_processed"
      type = "integer"

  [[inputs.redis.commands]]
      command = ["get", "stat:failed"]
      field = "sidekiq_stat_failed"
      type = "integer"


  [[inputs.redis.commands]]
      command = ["llen", "queue:#default"]
      field = "sidekiq_default_queue_len"
      type = "integer"

  [[inputs.redis.commands]]
      command = ["llen", "queue:#ingress"]
      field = "sidekiq_ingress_queue_len"
      type = "integer"

  [[inputs.redis.commands]]
      command = ["llen", "queue:#mailers"]
      field = "sidekiq_mailers_queue_len"
      type = "integer"

  [[inputs.redis.commands]]
      command = ["llen", "queue:#pull"]
      field = "sidekiq_pull_queue_len"
      type = "integer"

  [[inputs.redis.commands]]
      command = ["llen", "queue:#push"]
      field = "sidekiq_push_queue_len"
      type = "integer"

  [[inputs.redis.commands]]
      command = ["llen", "queue:#scheduler"]
      field = "sidekiq_scheduler_queue_len"
      type = "integer"

  [[inputs.redis.commands]]
      command = ["zcard", "schedule"]
      field = "sidekiq_scheduled"
      type = "integer"

  [[inputs.redis.commands]]
      command = ["zcard", "retry"]
      field = "sidekiq_retries"
      type = "integer"

  [[inputs.redis.commands]]
      command = ["zcard", "dead"]
      field = "sidekiq_dead"
      type = "integer"

  [[inputs.redis.commands]]
      command = ["scard", "processes"]
      field = "sidekiq_processes"
      type = "integer"
PostgreSQL information collection:
# If you're on baremetal, change "host=db" to point to postgres
#
# You can also set address to a url
# postgres://[pqgotest[:password]]@host:port[/dbname]?sslmode=[disable|verify-ca|verify-full]
#

# Monitor Postgres
[[inputs.postgresql]]
    address = "host=db user=postgres sslmode=disable"
    # give it a nice name
    outputaddress = "postgres-db01"
HTTP probe configuration:
# If you're running on bare-metal, replace MASTODON_DOMAIN
# with your domain, and web and streaming with 127.0.0.1
# Send HTTP probes to check that the service is responding
[[inputs.http_response]]
    urls = ["http://web:3000",
            "https://$MASTODON_DOMAIN"
            ]

    response_timeout = "5s"
    method = "GET"
    response_status_code = 200

    [inputs.http_response.headers]
      # CHANGEME: this must match your mastodon domain name
      Host = "$MASTODON_DOMAIN"
      X-Forwarded-Proto = "https"


# Check the streaming container, we expect a 401 because we're not including a valid token
[[inputs.http_response]]
    urls = ["http://streaming:4000"]

    response_timeout = "5s"
    method = "GET"
    response_status_code = 401

    [inputs.http_response.headers]
      # CHANGEME: this must match your mastodon domain name
      Host = "$MASTODON_DOMAIN"
      X-Forwarded-Proto = "https"
TLS Certificate Information Collection:
# If you're installing on bare-metal, replace $MASTODON_DOMAIN with your
# domain

# Check the TLS certificate being served
[[inputs.x509_cert]]
    sources = ["tcp://$MASTODON_DOMAIN:443"]
    tls_server_name = "$MASTODON_DOMAIN"
Host resource usage:
# If you're installing on bare-metal, uncomment the net plugin as you won't
# have docker net stats to use
[[inputs.cpu]]
  percpu = true
  totalcpu = true
  collect_cpu_time = false
  report_active = false
[[inputs.disk]]
  ignore_fs = ["tmpfs", "devtmpfs", "devfs", "overlay", "aufs", "squashfs"]
[[inputs.diskio]]
[[inputs.mem]]
#[[inputs.net]]
[[inputs.processes]]
[[inputs.swap]]
[[inputs.system]]
Docker stats:
# Skip this if you're not using docker
[[inputs.docker]]
  endpoint = "unix:///var/run/docker.sock"
  timeout = "5s"
  interval = "5m"
Output to InfluxDB
# If you're installing on bare-metal, replace each of these with the relevant values

# Write out to InfluxDB
[[outputs.influxdb_v2]]
  urls = ["$INFLUXDB_URL"]
  token = "$INFLUXDB_TOKEN"
  organization = "$INFLUXDB_ORG"
  bucket = "$INFLUXDB_BUCKET"
Save the file and exit.
If you're installing on bare-metal, copy the file to /etc/telegraf/ and systemctl start telegraf. If you're using docker, move onto the next section.
docker-compose.yml Changes
In the directory that your docker-compose.yml lives in, create a directory for Telegraf's files, and copy the configuration we just created into it
mkdir telegraf
cp /path/to/telegraf.conf telegraf/
Next, we're going to update docker-compose.yml to run a Telegraf instance using our configuration. Change the environment variables to provide domain and Influx information.
    mastodon-telegraf:
         image: telegraf
         restart: always
         user: telegraf:998
         container_name: mastodon-telegraf
         environment:
            MASTODON_DOMAIN: <replace with your mastodon domain>
            INFLUXDB_URL:  <replace with your InfluxDB URL>
            INFLUXDB_TOKEN: <token (or username:password for 1.x)>
            INFLUXDB_ORG: <org name, blank in 1.x)
            INFLUXDB_BUCKET: telegraf
            REPORTED_HOSTNAME: <hostname to report as>
            HOST_ETC: /hostfs/etc
            HOST_PROC: /hostfs/proc
            HOST_SYS: /hostfs/sys
            HOST_VAR: /hostfs/var
            HOST_RUN: /hostfs/run
            HOST_MOUNT_PREFIX: /hostfs

         volumes:
            - ./telegraf/telegraf.conf:/etc/telegraf/telegraf.conf
            - /var/run/docker.sock:/var/run/docker.sock
            - /:/hostfs:ro
Bring telegraf up
docker-compose up -d
If you check the container's logs, you should see it come up without complaint
docker logs mastodon-telegraf
And that's it, stats are now being collected and written out to InfluxDB.
Graphing
Now that we're collecting data, we need to present the state of the system in an accessible and easily consumable way.
The intent in this section isn't to list every possible query, just those that provide particularly interesting information.
If you're not interested in how to query for the data, a copy of my dashboard is available at https://github.com/bentasker/grafana_dashboards/tree/master/mastodon.
To allow for the possibility of future expansion, I'm in the habit of always creating a dashboard variable called host:
from(bucket: "telegraf")
  |> range(start: v.timeRangeStart, stop: v.timeRangeStop)
  |> filter(fn: (r) => r._measurement == "redis")
  |> keyValues(keyColumns: ["host"])
  |> group()
  |> keep(columns: ["_value"])

This allows us to use |> filter(fn: (r) => r.host == "${host}") within our queries to limit results to those from the selected instance.
For our first chart, we'll graph out the result of the healthcheck probes.
from(bucket: "telegraf")
|> range(start: v.timeRangeStart, stop: v.timeRangeStop)
|> filter(fn: (r) => r._measurement == "http_response")
|> filter(fn: (r) => r._field == "response_status_code_match")
|> filter(fn: (r) => r.host == "${host}")

|> keep(columns: ["_time", "_field", "_value", "server"])
|> aggregateWindow(every: v.windowPeriod, fn: min)

And then the SSL status checks
from(bucket: "telegraf")
|> range(start: v.timeRangeStart, stop: v.timeRangeStop)
|> filter(fn: (r) => r._measurement == "x509_cert")
|> filter(fn: (r) => r._field == "verification_code")
|> filter(fn: (r) => r.host == "${host}")
|> keep(columns: ["_time", "_field", "_value", "server"])
|> aggregateWindow(every: v.windowPeriod, fn: max)
// The HTTP checks use 1 for OK, and 0 for failure
// x509 is the inverse
// to keep the graphs consistent, invert this result
|> map(fn: (r) => ({r with _value: 1 - r._value}))

Whilst we're working with SSL, we can grab a calculation of the remaining lifetime of our certificate
from(bucket: "telegraf")
|> range(start: v.timeRangeStart, stop: v.timeRangeStop)
|> filter(fn: (r) => r._measurement == "x509_cert")
|> filter(fn: (r) => r._field == "expiry")
|> filter(fn: (r) => r.host == "${host}")
|> filter(fn: (r) => r.common_name == "${mastodon_domain}")
|> keep(columns: ["_time", "_field", "_value", "server", "common_name"])
|> aggregateWindow(every: v.windowPeriod, fn: max)
|> last()

Some Sidekiq statistics, including
Queue depth
from(bucket: "telegraf")
|> range(start: v.timeRangeStart, stop: v.timeRangeStop)
|> filter(fn: (r) => r._measurement == "redis_commands")
|> filter(fn: (r) => r._field == "sidekiq_default_queue_len" or
                    r._field == "sidekiq_ingress_queue_len" or
                    r._field == "sidekiq_mailers_queue_len" or
                    r._field == "sidekiq_pull_queue_len" or
                    r._field == "sidekiq_push_queue_len" or
                    r._field == "sidekiq_scheduler_queue_len"
)
|> filter(fn: (r) => r.host == "${host}")
|> last()
|> group()
|> reduce(fn: (r, accumulator) => ({sum: r._value + accumulator.sum}),
                                    identity: {sum: 0})

Message processing outcomes
from(bucket: "telegraf")
|> range(start: v.timeRangeStart, stop: v.timeRangeStop)
|> filter(fn: (r) => r._measurement == "redis_commands")
|> filter(fn: (r) => r._field == "sidekiq_stat_processed" or
                    r._field == "sidekiq_stat_failed"
)
|> filter(fn: (r) => r.host == "${host}")
|> keep(columns: ["_time", "_field", "_value"])
|> difference(nonNegative: true)
|> aggregateWindow(every: v.windowPeriod, fn: max)

We can also use a variation of this to show the average rate of messages
from(bucket: "telegraf")
|> range(start: v.timeRangeStart, stop: v.timeRangeStop)
|> filter(fn: (r) => r._measurement == "redis_commands")
|> filter(fn: (r) => r._field == "sidekiq_stat_processed" or
                    r._field == "sidekiq_stat_failed"
)
|> filter(fn: (r) => r.host == "${host}")
|> keep(columns: ["_time", "_field", "_value"])
|> derivative(nonNegative: true)
|> aggregateWindow(every: v.windowPeriod, fn: max)

The containers all have docker healthchecks enabled in docker-compose.yml, so we can also create a graph to show container healthcheck failures
from(bucket: "telegraf")
  |> range(start: v.timeRangeStart, stop: v.timeRangeStop)
  |> filter(fn: (r) => r._measurement == "docker_container_health")
  |> filter(fn: (r) => r._field == "failing_streak")
  |> filter(fn: (r) => r.host == "${host}")
  |> filter(fn: (r) => r.container_name == "postgres" or
                     r.container_name == "redis" or
                     r.container_name == "sidekiq" or
                     r.container_name == "streaming" or
                     r.container_name == "web"
  )
  |> keep(columns: ["_time", "_field", "_value", "container_name"])
  |> aggregateWindow(every: v.windowPeriod, fn: max)

We can use Docker's network stats to show network usage between users and our instance
from(bucket: "telegraf")
  |> range(start: v.timeRangeStart, stop: v.timeRangeStop)
  |> filter(fn: (r) => r._measurement == "docker_container_net")
  |> filter(fn: (r) => r._field == "tx_bytes" or
                       r._field == "rx_bytes"
  )
  |> filter(fn: (r) => r.host == "${host}")
  |> filter(fn: (r) => r.container_name == "web" or
                     r.container_name == "streaming"
  )
  |> keep(columns: ["_time", "_field", "_value", "container_name"])
  |> derivative(nonNegative: true, unit: 1s)
  |> aggregateWindow(every: v.windowPeriod, fn: mean)
  // Convert bytes to bits
  |> map(fn: (r) => ({r with _value: r._value * 8.0}))

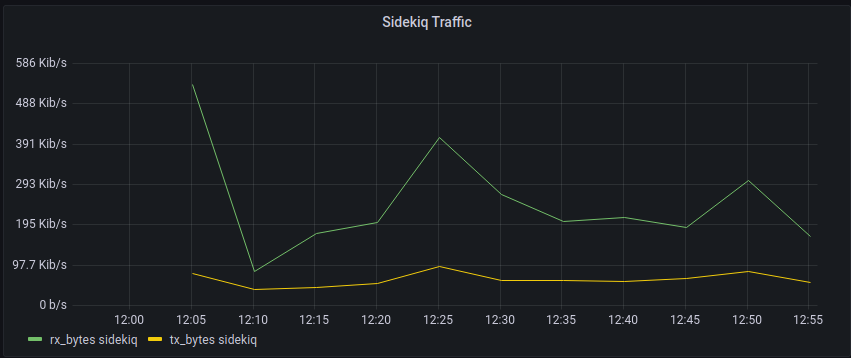
We can use the same query with a changed to the filter on r.container_name to show Sidekiq's activity
|> filter(fn: (r) => r.container_name == "sidekiq")
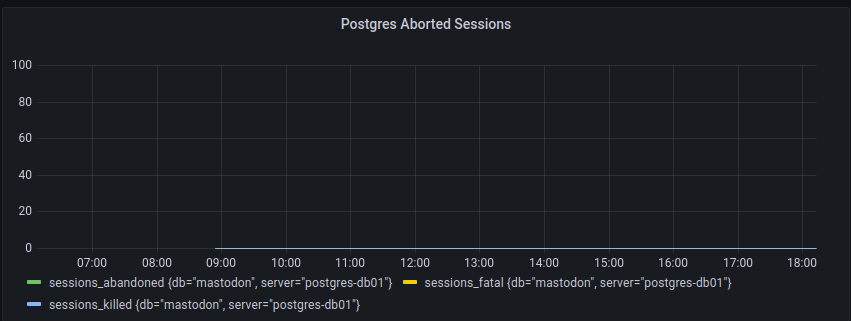
The following provides an overview of how many problematic sessions postgresql has observed (a sudden spike indicates that one of the other containers might be unhappy)
from(bucket: "telegraf")
  |> range(start: v.timeRangeStart, stop: v.timeRangeStop)
  |> filter(fn: (r) => r._measurement == "postgresql")
  |> filter(fn: (r) => r._field == "sessions_abandoned" or
                       r._field == "sessions_fatal" or
                       r._field == "sessions_killed"
  )
  |> filter(fn: (r) => r.host == "${host}")
  |> filter(fn: (r) => r.db == "mastodon")
  |> keep(columns: ["_time", "_field", "_value", "db", "server"])
  |> difference()
  |> aggregateWindow(every: v.windowPeriod, fn: max)
Putting those together with some other cells, we can build an at-a-glance overview of the state of the instance
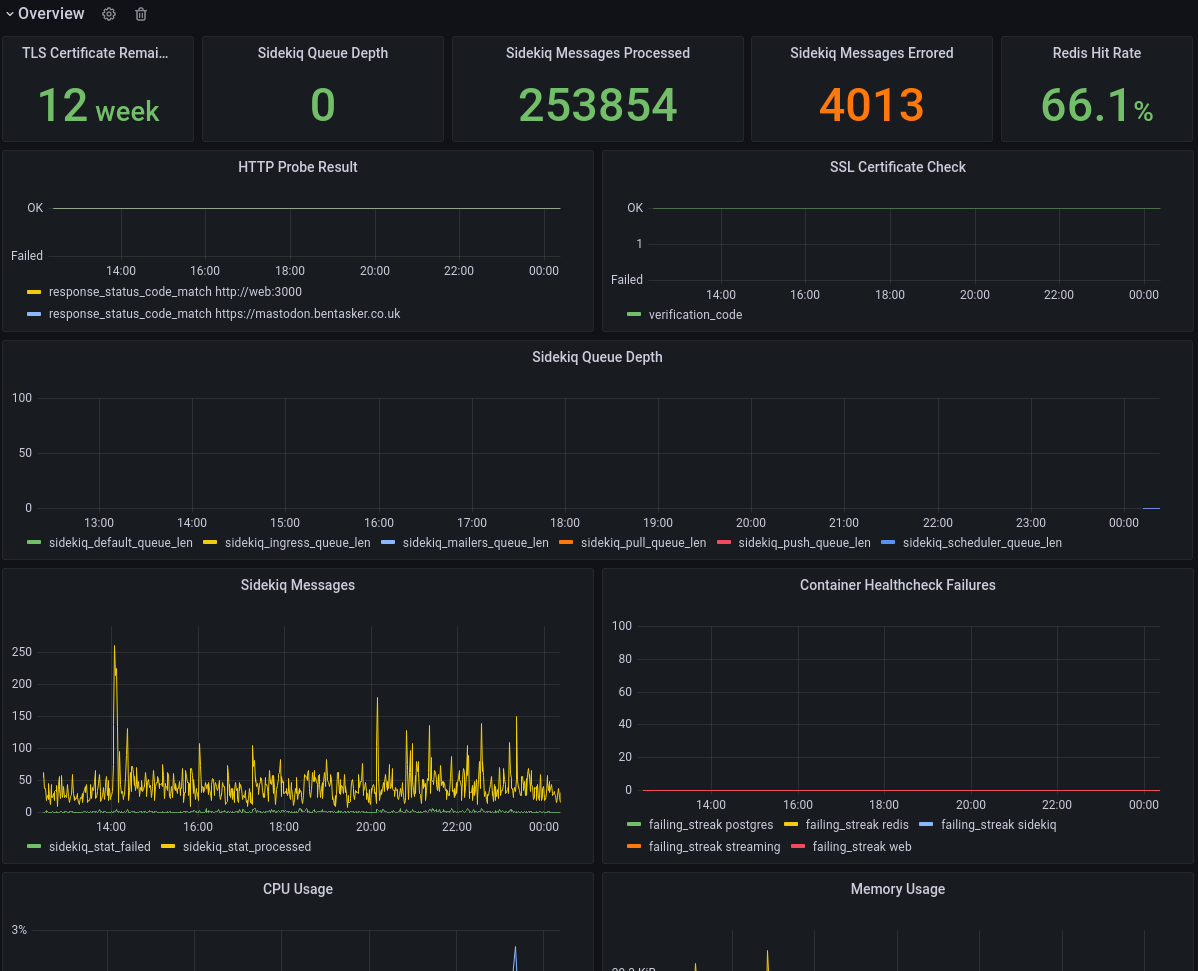
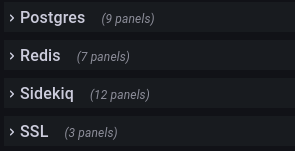
More detailed information on each component is then made available in collapsible panes (although they could also be spun out to dedicated dashboards):
Alerting
Graphs are helpful during troubleshooting and having each of the components graphed out in one location is helpful, but we're still very reliant on someone watching the graphs (which just isn't realistic in most cases).
This can be addressed by adding active-monitoring tools into the mix.
I've used kapacitor to set up active alerting for various mastodon related metrics.
For example, the following TICKscript monitors the HTTP probes and sends an alert email if they start failing
var groupBy = ['server']

var whereFilter = lambda: isPresent("response_status_code_match") AND "host" == 'docker-host'

var details = '

Probe down monitoring notication for {{ index .Tags "server" }}<br />
<br />
<b>Server:</b> {{ index .Tags "server" }}<br />
<b>State:</b> {{.Level}}<br />
<b>Duration:</b> {{index .Fields "state_duration"}} minutes<br />
<b>Status Code:</b> {{ index .Tags "status_code" }}<br />
<br />
----
{{.Tags}}<br /><br />
{{.Fields}}<br />
----
'

var data = stream
    |from()
        .database('telegraf')
        .retentionPolicy('autogen')
        .measurement('http_response')
        .groupBy(groupBy)
        .where(whereFilter)
    |eval(lambda: "response_status_code_match")
        .as('value')
    |stateDuration(lambda: "value" < 1)
        .unit(1m)

var trigger = data
    |alert()
        .warn(lambda: "state_duration" >= 1)
        .crit(lambda: "state_duration" >= 5)
        .stateChangesOnly()
        .message(' {{.ID}} is {{.Level}} for {{ index .Tags "server" }}')
        .id('HTTP Reachability {{ index .Tags "server" }}')
        .idTag('alertID')
        .levelTag('level')
        .messageField('message')
        .durationField('duration')
        .details(details)
        .email()
        .to('notifications@example.invalid')
Whereas this one creates a threshold based notification to alert if the SSL certificate is nearing expiry
var groupBy = ['common_name']

var whereFilter = lambda: "common_name" == 'mastodon.bentasker.co.uk'

var details = '

Certificate expiry notication for {{ index .Tags "common_name" }}<br />
<br />
<b>Validity Remaining:</b> {{ index .Fields "value" }}<br />
<br />
----
{{.Tags}}<br /><br />
{{.Fields}}<br />
----
'

var data = stream
    |from()
        .database('telegraf')
        .retentionPolicy('autogen')
        .measurement('x509')
        .groupBy(groupBy)
        .where(whereFilter)
    |eval(lambda: "expiry")
        .as('value')

var trigger = data
    |alert()
        .warn(lambda: "expiry" <= 1209600)
        .crit(lambda: "expiry" >= 604800)
        .stateChangesOnly()
        .message(' {{.ID}} is {{.Level}} for {{ index .Tags "server" }}')
        .id('Cert Age {{ index .Tags "server" }}')
        .idTag('alertID')
        .levelTag('level')
        .messageField('message')
        .durationField('duration')
        .details(details)
        .email()
        .to('notifications@example.invalid')
Of course, those alerts are only useful if the system is up and running.
We also want to receive an alert if the system goes down and stops sending us metrics. We can use a deadman check to achieve this.
var data = stream
    |from()
        .database('telegraf')
        .retentionPolicy('autogen')
        .measurement('mastodon')
        .groupBy(['host'])


var trigger = data
    |deadman(0.0, 10m)
        .stateChangesOnly()
        .message('Masto deadman for {{ index .Tags "host" }} is {{ .Level }} ')
        .id('Masto deadman {{ index .Tags "host" }}')
        .idTag('alertID')
        .levelTag('level')
        .messageField('message')
        .durationField('duration')
        .details('Masto deadman for {{ index .Tags "host" }} is {{ .Level }} ')
        .email()
Useful Information
Most of this section won't be relevant to most people, but I couldn't find it documented elsewhere, and having had to figure things out in the process of building this, thought they seemed worth noting.
Sidekiq doesn't expose its stats via http API (at least, not by default). It stores them in redis instead.
This intially confused the hell out of me: sidekiq is in a different container, so how was web communicating with it to show stats at /sidekiq? It was asking redis:
127.0.0.1:6379> get stat:processed
"253309"
127.0.0.1:6379> get stat:failed
"4010"
Queue depth information is a little harder to find, because a list is used
What Sidekiq is doing here is analogous to doing the following in redis-cli
# conn.sscan("queues").to_a
127.0.0.1:6379> SSCAN queues 0
1) "0"
2) 1) "scheduler"
   2) "pull"
   3) "ingress"
   4) "default"
   5) "mailers"
   6) "push"

127.0.0.1:6379> LLEN queue:#pull
(integer) 0
The same is true of all the other stats: retry count, scheduled messages etc.
A little tricky to find, but once you know it, it's easy to collect with Telegraf's redis plugin.
Redis runs in persistence mode.
Telegraf collects a wide range of statistics from the systems, so it's useful to have documentation available to look up what each of the stats means. Links include
Taking it further
Mastodon also stores some usage statistics in Redis.
These are a little harder to get at using a static configuration, because they tend to have a timestamp embedded into the key:
127.0.0.1:6379> KEYS *activity:interactions*
1) "activity:interactions:1668470400"
2) "activity:interactions:1668384000"
3) "activity:interactions:1668297600"
4) "activity:interactions:1668556800"
5) "activity:interactions:1668643200"
6) "activity:interactions:1668729600"
7) "activity:interactions:1668816000"
Each of the keys above contains the daily activity count for that day (the timestamp is midnight).
Mastodon calculates the key suffix here, but that's not something we can do directly within the config section for Telegraf's inputs.redis plugin.
However, because redis comms are text based, we can build a command to call via Telegraf's exec plugin. We're slightly limited in that we can only use the tool chain that's available within Telegraf's container.
The following establishes a connection to redis using the kernel's /dev/tcp interface and then retrieves today's interaction count.
exec 3<> /dev/tcp/redis/6379
printf "GET activity:interactions:`date --date="00:00" +"%s"`\nQUIT\n" >&3
COUNT=`cat <&3 | grep -o -P '^[0-9]+'`
echo "mastodon daily_interaction_count=${COUNT}i"
The final echo generates the following line protocol
mastodon daily_interaction_count=4i
(it's still early in the day here, so the count is low).
We then need to generously escape quotes and drop in a config statement
[[inputs.exec]]
  commands = [
   'bash -c "exec 3<> /dev/tcp/redis/6379; printf \"GET activity:interactions:`date --date=\"00:00\" +\"%s\"`\nQUIT\n\" >&3; COUNT=`cat <&3 | grep -o -P \"^[0-9]+\"`; echo \"mastodon daily_interaction_count=${COUNT}i\""'
  ]
  data_format = "influx"
We could, if we wanted, instead write the command into a shell script and export that into the container for execution by exec (realistically, this is what I'll do if and when I find more stats that I want to pull out).
Conclusion
Although I initially ran into some minor headaches figuring out data-flows within Mastodon, it's quite easy to extract statistics about the state of the system.
Those statistics can then be used to build dashboards, including an at-a-glance overview of the state of each of the components.
Active alerting tools like kapacitor (or Grafana's Unified Alerting) use the statistics to send pro-active alerts that something's going awry, so that we're not reliant on troubleshooting after the rhetorical has hit the wall.
Mastodon's redis database contains a wealth of statistics, many of which can be pulled using static telegraf config. Those that can't can trivially be retrieved using Telegraf's exec plugin to dynamically build key-names and pull the values.
Although I've not used it in this documentation, Telegraf's SQL input plugin can also be used to collect statistics on the data stored within Postgres, so it's possible to collect arbitray vectors like "number of posts containing the word foo".
Over time, it's likely that I'll discover and add more to my configuration (and likely update the config https://github.com/bentasker/grafana_dashboards/tree/master/mastodon too).