Building a serverless site availability monitoring platform with Telegraf, AWS Fargate and InfluxCloud
I use a free Uptime Robot account to help keep an eye on the availability of www.bentasker.co.uk.
Every 5 minutes, UptimeRobot places requests to my site (and it's origin) and reports on how long those requests take to complete and updates my status page if there are issues.
The free tier only tests from a single location, but is usually a good indicator of when things are going (or starting to go) wrong. I use my uptime-robot exec plugin for Telegraf to pull stats from UptimeRobot into InfluxDB for use in dashboards.
Because I test against my origin as well as the CDN, it's usually possible to tell (roughly) where an issue lies: if CDN response time increases, but origin doesn't, then the issue is likely on the CDN.
Earlier in the week, I saw a significant and sustained increase in the latency UptimeRobot was reporting for my site, with no corresponding change in origin response times.
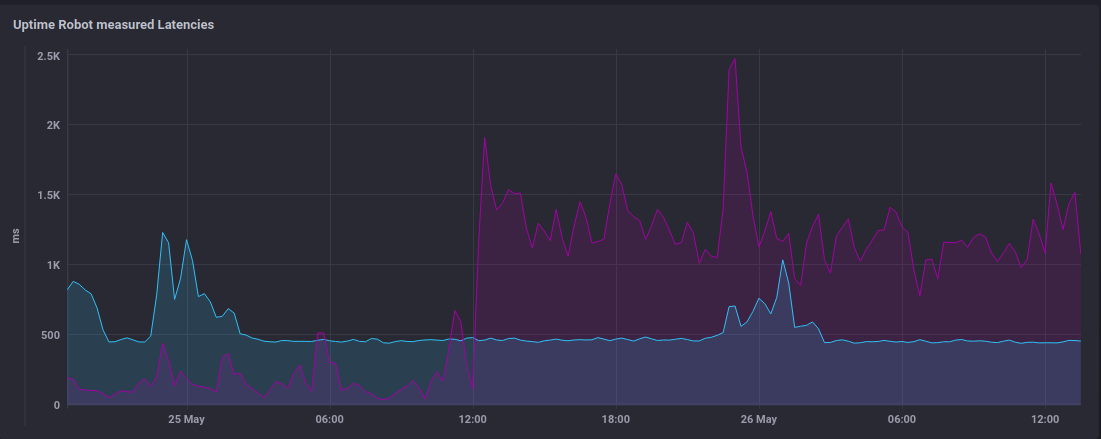
This suggests possible CDN issues, but the increase wasn't reflected in response time stats drawn from other sources:
- There was no increase in the response time metrics recorded by my Privacy Friendly Analytics system
- The Telegraf instance (checking the same endpoints) on my LAN wasn't reporting an increase
Given that pfanalytics wasn't screaming at me and that I couldn't manually reproduce the issue, I felt reasonably confident that whatever this was, it wasn't impacting real users.
But, I decided that it would be useful to have some other geographically distributed availability system that I could use for investigation and corroboration in future.
I chose to use Amazon's Elastic Container Server (ECS) with AWS Fargate to build my solution.
This post walks through the process of setting up a serverless solution which runs Telegraf in a Fargate cluster and writes availability data into a free InfluxDB Cloud account.
Why Fargate?
We could achieve the same aim by running Telegraf on some EC2 instances: setup would be absolutely trivial.
However, Telegraf is only going to be polling periodically and the EC2 instances would be running (and being billed for) constantly.
With Fargate we only pay for the time that a container uses (with a minimum billing period of 1 minute per invocation), so we should be able to reduce costs significantly by running Telegraf's docker image within Fargate.
At time of writing, AWS's pricing in us-east-2 is
-
EC2
t3.microcharged at $0.0104/hr ($7.20 month) - Fargate: charged at $0.04048 per vcpu/hr + $0.004445 GB RAM/hr
(data transfer is extra, but is the same rate for each)
To work out likely Fargate costs we need to make a few calculations based on the following criteria
- average run will always be < 1 minute (in practice it's actually more like 2 seconds, so there's a good margin for error here)
- we use 0.25 vcpu and 0.5GB RAM (I tested and this is more than enough for our purposes)
- we run at 5 minute intervals
We can work out the expected cost as follows
cpu_seconds = 720 # 1 minute of billed time every 5min (60*12)
num_cpus = 0.25 # 0.25 vcpu
gb_ram = 0.5
hourly_cpu_cost = 0.04048
hourly_ram_cost = 0.004445

# Calculate
cpu_cost_second = hourly_cpu_cost / 3600
billed_cpu_cost = (cpu_seconds * cpu_cost_second) * num_cpus
ram_cost_second = hourly_ram_cost / 3600
billed_ram_cost = (ram_cost_second * cpu_seconds) * gb_ram

# Total
total_cost = billed_ram_cost + billed_cpu_cost
print(f"{total_cost} (cpu: {billed_cpu_cost}, ram: {billed_ram_cost})")
Our expected cost for Fargate is $0.002469/hr ($1.777/month), plus data charges.
Telegraf Config Setup
We're going to use quite a simple Telegraf configuration, relying entirely on Telegraf's http_response plugin.
The configuration for this is as simple as
[[inputs.http_response]]
    urls = [
    "https://www.bentasker.co.uk",
    "https://origin.bentasker.co.uk"
            ]
    response_status_code = 200
We also want a tag value to report the region the probe is testing from. We'll set the value via environment variable, so we create a section to define the tag and pull the value from the container's environment.
[global_tags]
  region = "${TEST_REGION}"
For flexibility, we want the configuration file to be held centrally (so that each region we test from can pull the same single config file and receive any future updates we make to it).
We don't want to host our config on the infrastructure we're supposed to be monitoring, either, because it'd mean Telegraf probes would go down when we need them most (when we're down).
Luckily, Influx Cloud allows us to create and host Telegraf config files

Selecting http_response gives us a prefilled config template, which we can then adjust to suit our needs
# Configuration for telegraf agent
[agent]
  interval = "20s"
  round_interval = true
  metric_batch_size = 1000
  metric_buffer_limit = 10000
  collection_jitter = "0s"
  flush_interval = "10s"
  flush_jitter = "0s"
  precision = ""
  hostname = ""
  # We don't care about the hostname of the probe
  omit_hostname = true

[[inputs.http_response]]
    urls = [
    "https://www.bentasker.co.uk",
    "https://origin.bentasker.co.uk/"
    ]
    response_status_code = 200

[global_tags]
  region = "${TEST_REGION}"

[[outputs.influxdb_v2]]
  urls = ["https://eu-central-1-1.aws.cloud2.influxdata.com"]
  token = "$INFLUX_TOKEN"
  organization = "<my orgname>"
  bucket = "telegraf"
Once we save, InfluxCloud provides a URL and a token, both of which we'll use later.
Telegraf Invocation
The Telegraf docker container, by default, runs Telegraf as a service.
We don't want to pay for the time between collection intervals though, so we need Telegraf to run once and then exit. Luckily, there's a --once option which tells it to do a metrics run, write to outputs and then exit.
We also need to tell Telegraf where to find our InfluxCloud configuration file (with --config) and export some environment variables.
If we were running on a standard server, the commands we'd use for this would be (change eu-west to whatever string works best for you)
export INFLUX_TOKEN="<token>"
export TEST_REGION="eu-west"
telegraf --once --config "<influxcloud telegraf url>"
Later, we'll use this as a guide to help us configure the container in AWS.
Fargate Setup
Next, we need to do the AWS side setup. The process is actually quite simple.
Log into console.aws.amazon.com and go to the Elastic Containers Service.
Then, create a cluster using the Fargate type (tick to create a new VPC if you want to seperate this out from your other AWS infra)

Go to Task Definitions and click Create new Task Definition, choose FARGATE and define a few options

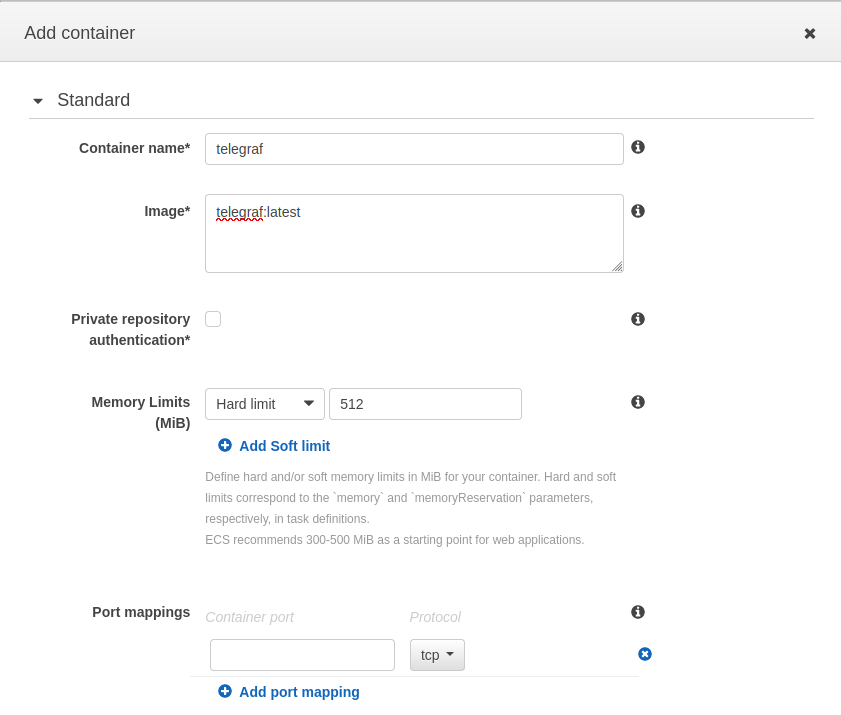
Next, scroll down and click Add container
Set the standard container options:
- Name:
telegraf - Image:
telegraf:latest
And optionally define a memory limit
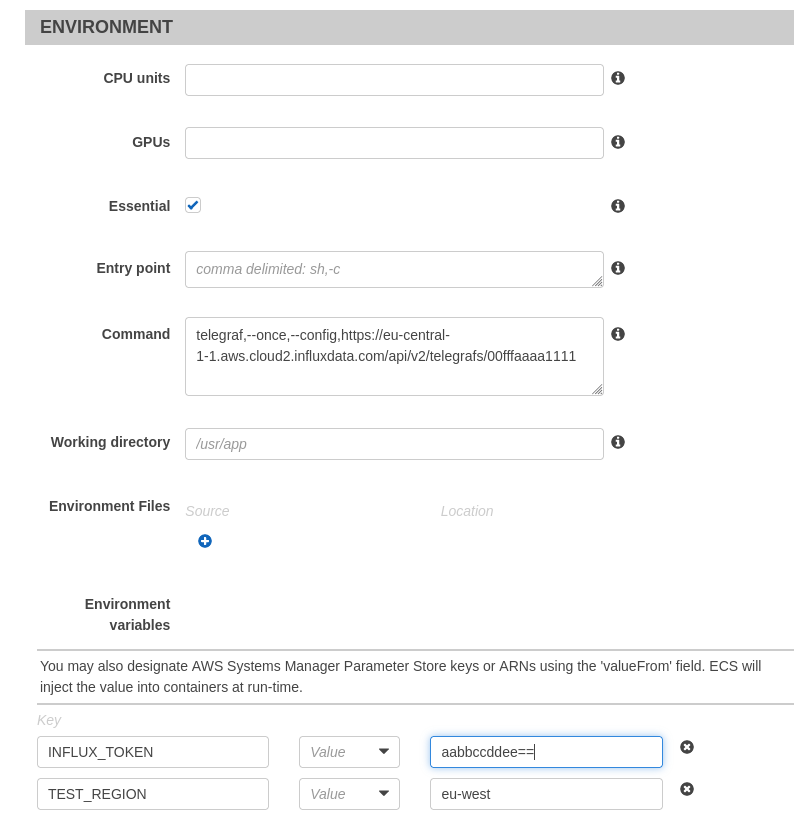
In the Environment section we override a few options:
We set the command to
telegraf,--once,--config,https://eu-central-1-1.aws.cloud2.influxdata.com/api/v2/telegrafs/00fffaaaa1111
Where the URL is the URL to our InfluxCloud hosted Telegraf configuration file. This is the command we designed in Telegraf Invocation with the command segments delimited by commas rather than spaces.
We then set a couple of environment variables
INFLUX_TOKEN: <token>
TEST_REGION: eu-west
These are the exports we used in Telegraf Invocation. Note: These can't be edited without deleting and recreating the container definition, but they can be overridden when the task is scheduled later.
Which should lead to the interface looking something like this
Click Add followed by Create and the task definition is created.
First Run
We can now run the task manually to check that everything is working
- Back to the
Tasks DefinitionPage - Check the box for the relevant Task Definition
-
Actions->Run Task - Choose
FARGATE - Set Operating System Family to
Linux - Select your Cluster
- Select the VPC
- Select a subnet
- Click
Run Task
The task will be created and triggered

If you click the little refresh icon, the task should eventually disappear (and only be visible when you change Desired task status to Stopped).
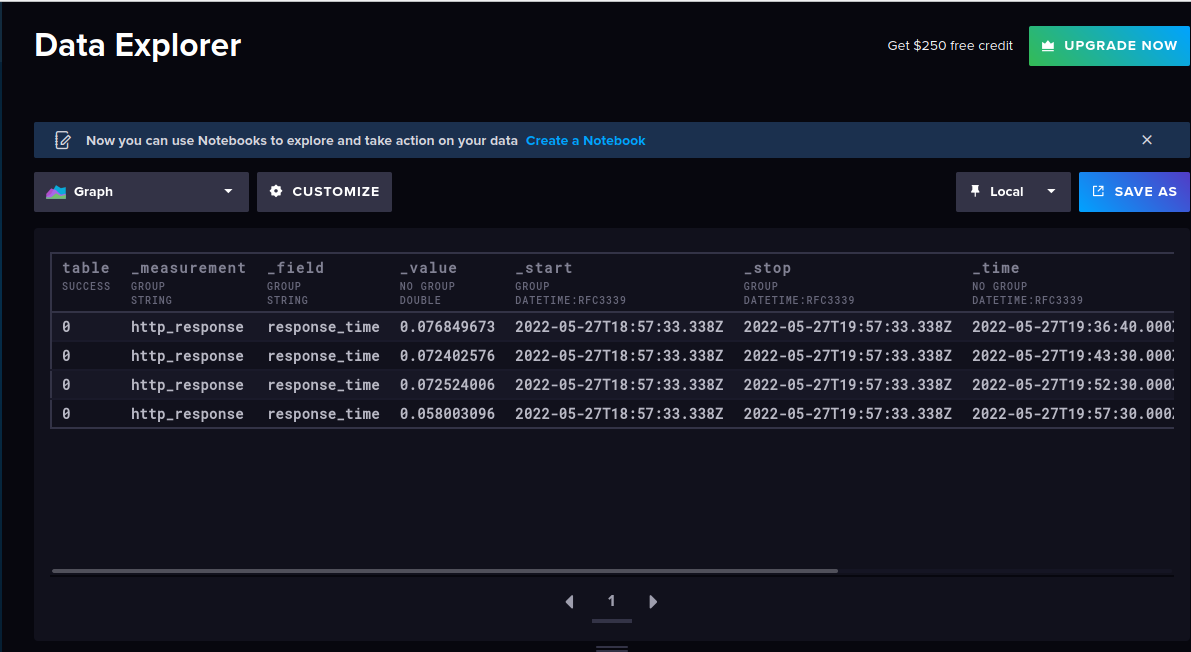
At this point, there should be data in our InfluxCloud bucket
from(bucket: "telegraf")
  |> range(start: v.timeRangeStart, stop: v.timeRangeStop)
  |> filter(fn: (r) => r["_measurement"] == "http_response")
  |> filter(fn: (r) => r["_field"] == "response_time")
Scheduling
Next we want to schedule the task to run automatically at a fixed interval
- Go to
Clusters - Click into the Fargate Cluster
- Click the
Scheduled Taskstab - Click
Create - Set a recognisable name (I used
TelegrafFargate) - Ensure the Schedule rule type is
Run at fixed interval - Set the Interval to 5 minutes
- Set a recognisable ID (I used
telegraf-website-monitor) - Set Launch type to
FARGATE - Select your task
- Number of tasks: 1
- Select a VPC
- Select a Subnet

Click Create.
Note: the task will also now show up as a rule in AWS Eventbridge.
In most regions, the task will trigger immediately (Singapore seems to be an exception - it waits until the next interval to run) and then will run at 5 minute intervals after that.
Repeat in other regions
We can then follow the exact same process (changing only the value of our TEST_REGION environment variable) within other AWS regions so that we have probes coming from different parts of the globe.
Graphing
Now that we're ingesting data, we need to visualise it.
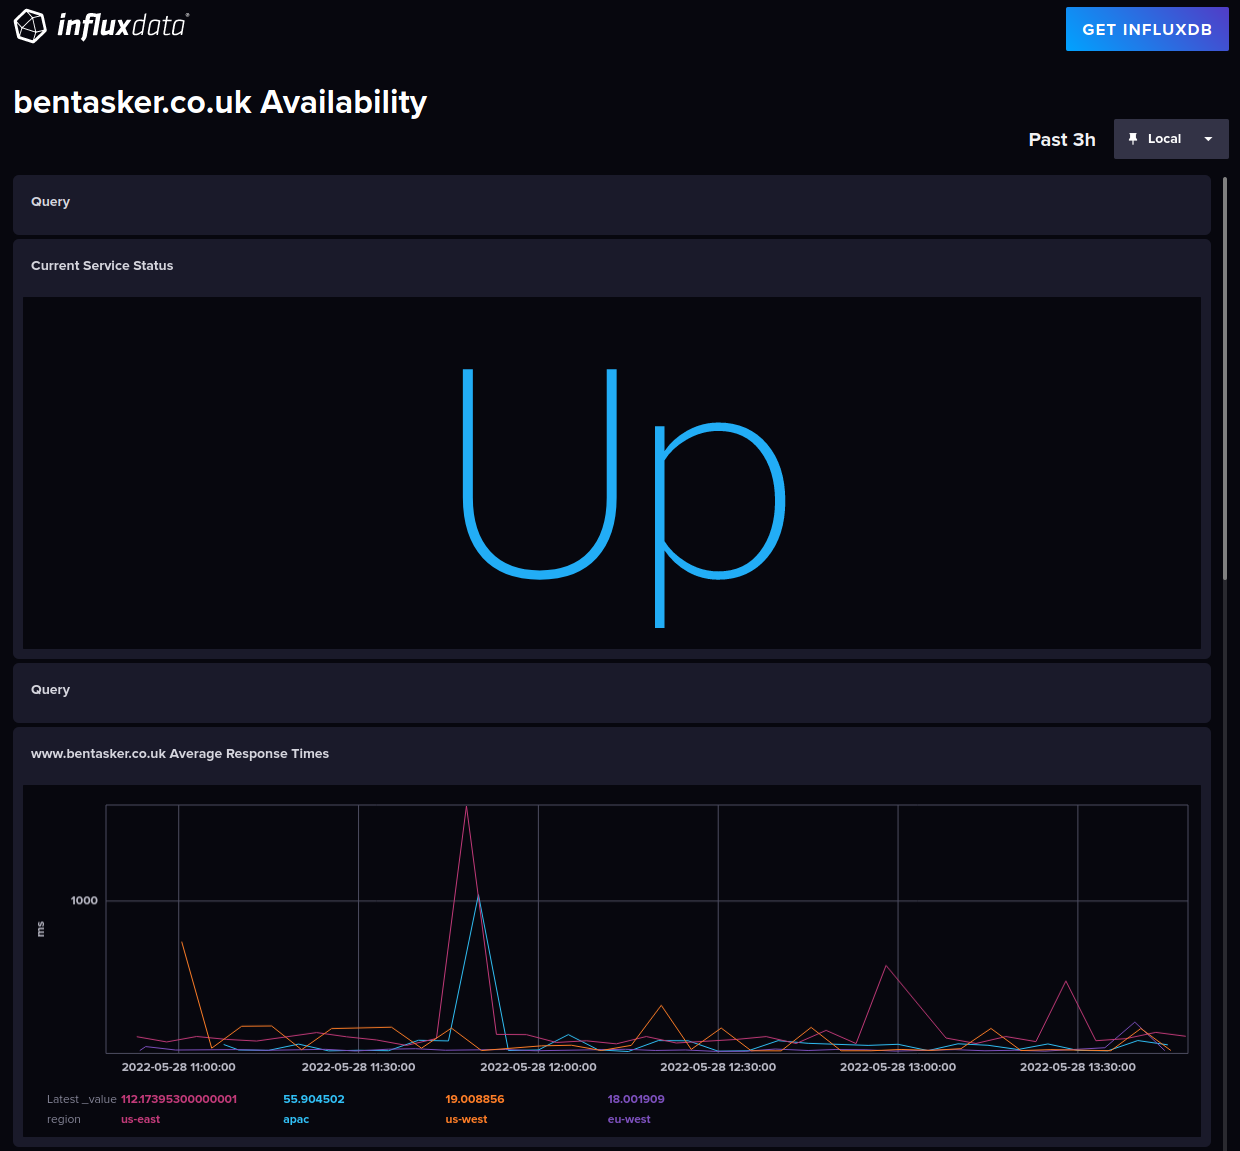
We're going to use an InfluxCloud Notebook because a Notebook has the option to be publicly shared, meaning that it could potentially be used as a service status page.
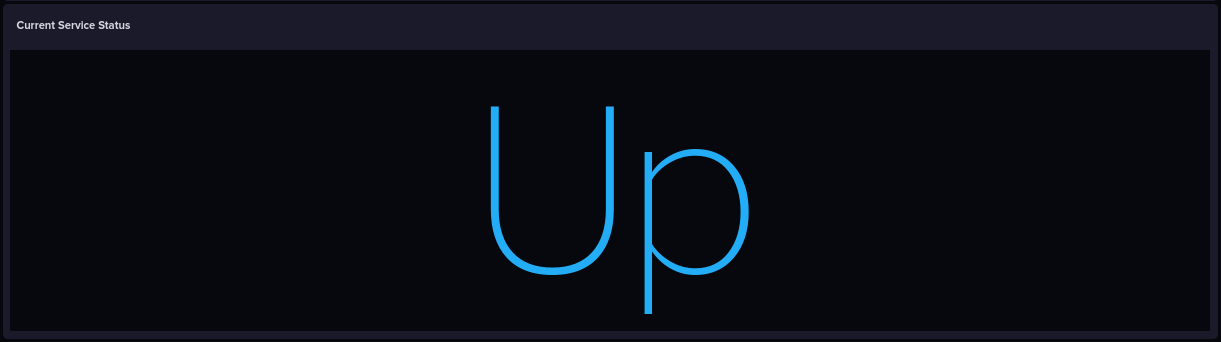
To calculate the current service status we take values from the last write by each probe (using last()).
Telegraf's http_response input plugin sets response_status_code_match to 1 if the HTTP response code matches the value we specified in config (in this case, a 200) and 0 if not.
We want to be able to add and remove probes without needing to adjust the query thresholds, so we average the result. Because the maximum possible value is 1 we can treat this as a percentage value.
- If the value is
1(100%), everything isUp - If
> 0.75then things areMostly Up - If over half (
0.5) are up then we'reDegraded - If
< 0.5are up, then consider usDown
This logic can be implemented via the following Flux query
from(bucket: "telegraf")
  |> range(start: v.timeRangeStart, stop: v.timeRangeStop)
  |> filter(fn: (r) => r["_measurement"] == "http_response")
  |> filter(fn: (r) => r["_field"] == "response_status_code_match")
  |> filter(fn: (r) => r["server"] == "https://www.bentasker.co.uk")
  |> last()
  |> group()
  |> mean()
  |> map(fn: (r) => ({r with _value:
    if r._value == 1 then
       "Up"
    else if r._value < 1 and r._value > 0.75 then
       "Mostly Up"
    else if r._value < 0.75 and r._value > 0.5 then
       "Degraded"
    else
       "Down"
  }))
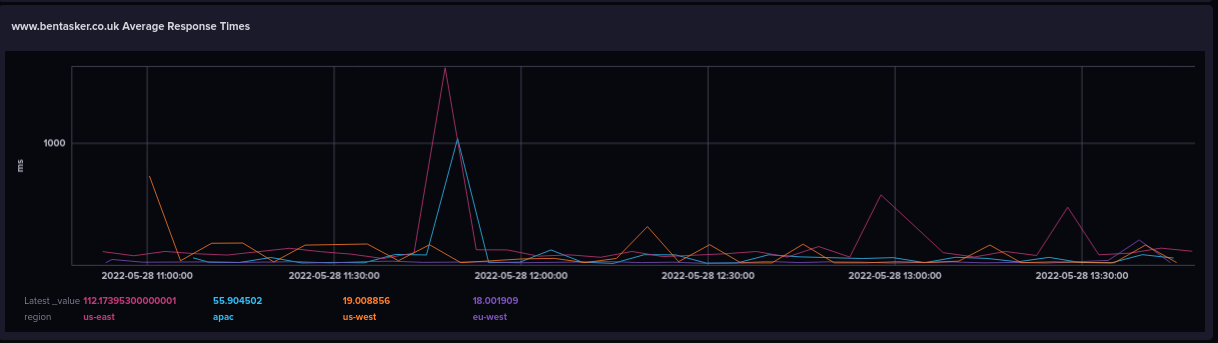
We can use a comparatively simple query to create a graph of response times
from(bucket: "telegraf")
  |> range(start: v.timeRangeStart, stop: v.timeRangeStop)
  |> filter(fn: (r) => r["_measurement"] == "http_response")
  |> filter(fn: (r) => r["_field"] == "response_time")
  |> filter(fn: (r) => r["server"] == "https://www.bentasker.co.uk")
  |> group(columns: ["region", "server"])
  |> aggregateWindow(every: v.windowPeriod, fn: mean, createEmpty: false)
  |> map(fn: (r) => ({
      _time: r._time,
      _field: r._field,
      _value: r._value * 1000.0,
      region: r.region,
      server: r.server
  }))
We select results for the site, calculate a periodic mean and then use map() to convert the value to milliseconds.
Next, we might want a cell displaying some headline stats, the query for this is a little more complex as we need to use join() to get our aggregates into the same table.
// Select the data
data = from(bucket: "telegraf")
  |> range(start: v.timeRangeStart, stop: v.timeRangeStop)
  |> filter(fn: (r) => r["_measurement"] == "http_response")
  |> filter(fn: (r) => r["_field"] == "response_time")
  |> filter(fn:(r) => r["server"] == "https://www.bentasker.co.uk")
  |> group(columns: ["region"])
  |> map(fn:(r) => ({r with _value: r._value * 1000.0}))
  |> keep(columns: ["_value", "region"])

// Calculate aggregates
mean = data
  |> mean()

max = data
  |> max()

min = data
  |> min()

p95 = data
  |> quantile(q:0.95)


// Perform joins
j1 = join(tables: { mean: mean, max: max },
      on: ["region"],
      method: "inner"
   )

j2 = join(tables: { min: min, j1: j1 },
      on: ["region"],
      method: "inner"
    )

joined = join(tables: { min: j2, perc: p95 },
      on: ["region"],
      method: "inner"
    )

// Format for output
joined
  |> map(fn: (r) => ({
      region: r.region,
      min: r._value_min,
      max: r._value_max,
      mean: r._value_mean,
      p95: r._value_perc
  }))
  |> group()

So that we've the ability to prove any variations on/off CDN, we create the same set of cells for the probes that go to the origin: same queries, different filter for the server tag.
from(bucket: "telegraf")
  |> range(start: v.timeRangeStart, stop: v.timeRangeStop)
  |> filter(fn: (r) => r["_measurement"] == "http_response")
  |> filter(fn: (r) => r["_field"] == "response_time")
  |> filter(fn: (r) => r["server"] == "https://origin.bentasker.co.uk")
  |> group(columns: ["region", "server"])
  |> aggregateWindow(every: v.windowPeriod, fn: mean, createEmpty: false)
  |> map(fn: (r) => ({
      _time: r._time,
      _field: r._field,
      _value: r._value * 1000.0,
      region: r.region,
      server: r.server
  }))

Conclusion
I seem to have got through this post without accidentally typoing in either Farscape or Stargate, so let's take a look at what we've done:
- Created a Telegraf configuration file hosted on InfluxCloud
- Configured a Fargate cluster on Amazon's Elastic Container Service
- Created a task definition to run a Telegraf docker container
- Configured that container to fetch our InfluxCloud config, do a metrics run based upon it and then exit
- Created a Notebook in InfluxCloud
The result is a serverless setup feeding into a page which can be shared publicly to display an overview of current service status.
There are improvements that could be made on the setup I've built:
- It'd probably be prudent to move the InfluxCloud token from an environment variable into AWS Secrets Manager
- An additional tag and environment variable could be added to note the provider the probe's running on: that way a multicloud setup could be used to probe from different cloud environments
At some point, I might also create a variation of the notebook that can be sent to my CDN provider on trouble tickets.
They inject various response headers
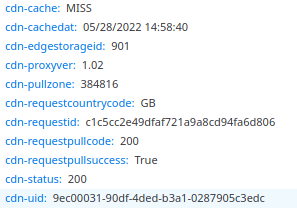
Using the http_response plugin's http_header_tags config option would allow these values to be included in the Notebook to facilitate troubleshooting.
Setup of this Fargate based solution is relatively cheap, coming in at around $1.78/month per probe. My total bill for running in 4 regions should be about $7.12 a month, less than a quarter of the $28.80/month cost of a solution built around EC2 t3.micro instances.