Running and monitoring a Minecraft server using Docker and Linux
Running a Minecraft server has always been fairly painless, with the biggest headache usually being getting the right version of Java up and running.
I wanted to find an even simpler route, though, and wanted something that gave me the ability to monitor the server (if only so I could fix stuff before getting complained at).
Although I came into this ready to build my own images, it turns out a bloke called Geoff has done a sterling job not only of dockerising Minecraft-server, but also creating a monitoring tool.
This documentation details how to tie that all together in order to use Docker to stand up a Minecraft Java edition server and monitor it using Telegraf to push monitoring data into InfluxDB or InfluxCloud. Technically, this should all work with running a Bedrock server too, but I've not tried that.
This document assumes you're running Ubuntu, but if you're not then it's only really the Docker installs steps which are Ubuntu specific.
Monitoring Database
We're going to be pushing stats into InfluxDB - Telegraf does support other outputs, but that's out of scope for this post.
It's assumed that you already have an InfluxDB instance running. If you do not, then a free Influx Cloud account will also work.
Pre-config
The very first thing we need to do, is Install Docker.
I used the following steps
sudo -s
apt-get update
apt-get install ca-certificates curl gnupg lsb-release

# Get their key
curl -fsSL https://download.docker.com/linux/ubuntu/gpg | gpg --dearmor -o /usr/share/keyrings/docker-archive-keyring.gpg

# Add the repo
echo \
  "deb [arch=$(dpkg --print-architecture) signed-by=/usr/share/keyrings/docker-archive-keyring.gpg] https://download.docker.com/linux/ubuntu \
  $(lsb_release -cs) stable" | tee /etc/apt/sources.list.d/docker.list > /dev/null

# Update and install
apt-get update
apt-get install docker-ce docker-ce-cli containerd.io
We're going to manage containers using docker-compose so we also need to install that
curl -L "https://github.com/docker/compose/releases/download/1.29.2/docker-compose-$(uname -s)-$(uname -m)" -o /usr/local/bin/docker-compose
chmod +x /usr/local/bin/docker-compose
As we're going to be exposing services, we should restrict access
apt-get install iptables-persistent

iptables -N minecraft
iptables -A minecraft -s 127.0.0.1 -j ACCEPT
iptables -A minecraft -s [YOUR IP] -j ACCEPT
iptables -A minecraft -j REJECT
iptables -I INPUT -p tcp --dport 25565 -j minecraft
iptables -I FORWARD -p tcp --dport 25565 -j minecraft
ip6tables -I INPUT -p tcp --dport 25565 -j REJECT
ip6tables -I FORWARD -p tcp --dport 25565 -j REJECT

iptables -N telegraf
iptables -A telegraf -s 127.0.0.1 -j ACCEPT
iptables -A telegraf -j REJECT
iptables -I INPUT -p tcp --dport 8094 -j telegraf
iptables -I FORWARD -p tcp --dport 8094 -j telegraf

ip6tables -I INPUT -p tcp --dport 8094 -j REJECT
ip6tables -I FORWARD -p tcp --dport 8094 -j REJECT

iptables-save > /etc/iptables/rules.v4
ip6tables-save > /etc/iptables/rules.v6
Note: I've chosen to restrict access to minecraft to specific IPs. If you want to allow worldwide access, then you can run iptables -I minecraft -j ACCEPT in order to do so.
Having restricted access, we can now look at getting our containers running.
We're going to be running 3 images:
-
minecraft: The minecraft server (itzg/minecraft-server) -
telegraf: Telegraf collects and forwards system level stats (_/telegraf) -
monitor: A container runningmc-monitorto pull stats fromminecraftand push them intotelegraf(itzg/mc-monitor)
Filesystem structure
We need to setup a heirachy for our files to be stored in, so
mkdir -p /usr/local/share/$HOSTNAME/compose
mkdir -p /usr/local/share/$HOSTNAME/files
mkdir -p /usr/local/share/$HOSTNAME/files/telegraf
mkdir -p /usr/local/share/$HOSTNAME/files/data
The directory data will contain all minecraft data - this is how your server will persist between container restarts/reboots etc.
The telegraf directory is where we'll put Telegraf's configuration file.
docker-compose.yml
Our compose file is pretty simple - it defines the 3 containers and the paths they should use for volumes.
This should be saved to /usr/local/share/$HOSTNAME/compose/docker-compose.yml
version: '3.1'

services:
    minecraft:
       image: itzg/minecraft-server
       container_name: minecraft
       hostname: minecraft
       restart: unless-stopped
       tty: true
       stdin_open: true
       ports:
         - "25565:25565"
       environment:
         EULA: "TRUE"
       volumes:
         - ../files/data:/data

    telegraf:
         image: telegraf
         restart: always
         user: telegraf:998
         container_name: telegraf
         network_mode: "host"
         environment:
            HOST_ETC: /hostfs/etc
            HOST_PROC: /hostfs/proc
            HOST_SYS: /hostfs/sys
            HOST_VAR: /hostfs/var
            HOST_RUN: /hostfs/run
            HOST_MOUNT_PREFIX: /hostfs
         volumes:
            - ../files/telegraf/telegraf.conf:/etc/telegraf/telegraf.conf
            - /var/run/docker.sock:/var/run/docker.sock
            - /:/hostfs:ro

    monitor:
        image: itzg/mc-monitor
        command: gather-for-telegraf
        network_mode: "host"
        container_name: mc_monitor
        environment:
           GATHER_INTERVAL: 1m
           GATHER_TELEGRAF_ADDRESS: 127.0.0.1:8094
           GATHER_SERVERS: 127.0.0.1
We have telegraf configured to use host networking because we want it to be able to report on the host's network interface usage. mc-monitor needs to be able to push in to telegraf via loopback, so that also needs to be on loopback. In all honesty, I probably could've solved this a bit more cleanly.
Telegraf Config
Before we can spin our containers up, we need to give Telegraf some configuration.
This should be saved to /usr/local/share/$HOSTNAME/files/telegraf/telegraf.conf
[agent]
  interval = "1m"
  round_interval = true

  metric_batch_size = 1000
  metric_buffer_limit = 10000
  collection_jitter = "0s"

  flush_interval = "10s"
  flush_jitter = "0s"

  precision = ""

  debug = false
  quiet = true

  logfile = ""
  hostname = "minecraft"
  omit_hostname = false

[[inputs.cpu]]
  percpu = true
  totalcpu = true
  collect_cpu_time = false
  report_active = false
[[inputs.disk]]
  ## Set mount_points will restrict the stats to only the specified mount points.
  # mount_points = ["/"]
  ## Ignore mount points by filesystem type.
  ignore_fs = ["tmpfs", "devtmpfs", "devfs", "overlay", "aufs", "squashfs"]
[[inputs.diskio]]
[[inputs.mem]]
[[inputs.net]]
[[inputs.processes]]
[[inputs.swap]]
[[inputs.system]]

[[inputs.docker]]
  endpoint = "unix:///var/run/docker.sock"
  timeout = "5s"
  interval = "5m"


[[inputs.socket_listener]]
  service_address = "tcp://:8094"
You can add or remove input plugins as required, but inputs.socket_listener is required for monitor to write into.
You will also need to define an output section. If you're using InfluxDB Cloud or InfluxDB 2.x then it'll likely look something like
[[outputs.influxdb_v2]]
  urls = ["https://eu-central-1-1.aws.cloud2.influxdata.com"]
  token = "[my token]"
  bucket = "telegraf"
If you're running InfluxDB 1.x, it'll look more like
[[outputs.influxdb]]
  urls = ["http://[my_server]:8086"]
  database = "telegraf"
Whichever meets your needs should be appended to /usr/local/share/$HOSTNAME/files/telegraf/telegraf.conf.
Launching
With everything in place, we're now ready to launch the containers
cd /usr/local/share/$HOSTNAME/compose
docker-compose up -d
The containers will start, and Minecraft should become reachable on your_ip:25565 from whichever IP's you've whitelisted in the firewall rules. At this point, you should be able to go into Multiplayer in Minecraft Java-edition and choose Add Server to add your server's IP/FQDN.
Within a few minutes, you should start seeing statistics in your InfluxDB database/bucket, so the next thing to do is to create a dashboard for reporting.
Reporting
Reporting on basic system and Docker stats with Telegraf is well covered elsewhere on the internet, so I won't go into too much depth on those here.
We do, however, want to create a dashboard showing our Minecraft server stats - I use Chronograf over Grafana but the underlying queries should be the same either way.
Server Response Time is reported by mc-monitor and details how quickly the server responded to probes
from(bucket: "telegraf/autogen")
  |> range(start: v.timeRangeStart, stop: v.timeRangeStop)
  |> filter(fn: (r) => r._measurement == "minecraft_status")
  |> filter(fn: (r) => r._field == "response_time")
  |> group(columns: ["host","port","status"])
  |> aggregateWindow(every: 5m, fn: mean)
  |> map(fn: (r) => ({r with _value: r._value * 1000.00}))
Series are broken into error and succes

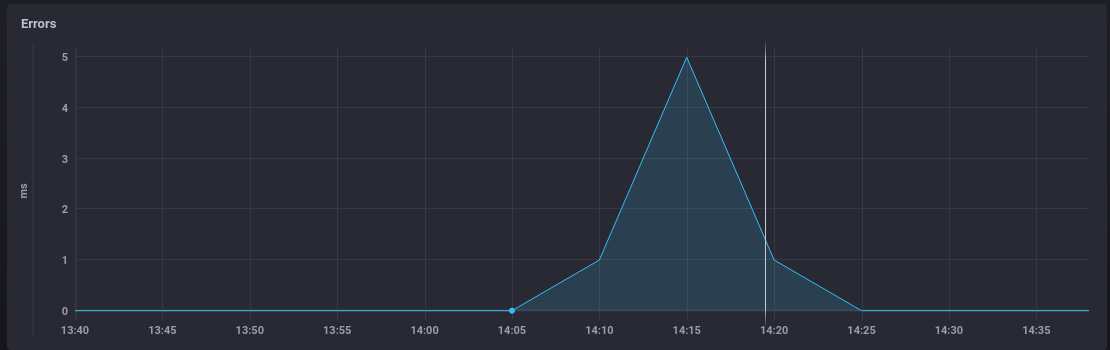
That graph gives an indication of when errors occurred, but it's useful to be able to see how many errors happened
from(bucket: "telegraf/autogen")
  |> range(start: v.timeRangeStart, stop: v.timeRangeStop)
  |> filter(fn: (r) => r._measurement == "minecraft_status")
  |> filter(fn: (r) => r._field == "response_time")
  |> filter(fn: (r) => r.status == "error")
  |> group(columns: ["host","port"])
  |> aggregateWindow(every: 5m, fn: count)
When troubleshooting, it's useful to be able to try and tie increases in error rate, or response time, to resource usage, so it's worth graphing out information collected from Docker
// Memory Usage
from(bucket: "telegraf/autogen")
  |> range(start: v.timeRangeStart)
  |> filter(fn: (r) => r._measurement == "docker_container_mem" and r._field == "usage")
  |> filter(fn: (r) => r.container_name == "minecraft")
// CPU Usage
from(bucket: "telegraf/autogen")
  |> range(start: v.timeRangeStart)
  |> filter(fn: (r) => r._measurement == "docker_container_cpu" and r._field == "usage_percent")
  |> filter(fn: (r) => r.container_name == "minecraft")
// Network usage
from(bucket: "telegraf/autogen")
  |> range(start: v.timeRangeStart)
  |> filter(fn: (r) => r._measurement == "docker_container_net")
  |> filter(fn: (r) => r._field == "rx_bytes" or r._field == "tx_bytes")
  |> filter(fn: (r) => r.container_name == "minecraft")
  |> map(fn: (r) => ({r with _value: r._value * 8}))
  |> derivative(unit: 1s, nonNegative: true)
  |> keep(columns: ["_time", "_value", "_field"])
Giving a set of three graphs

It'd be remiss of us to not also graph out the player stats that mc-monitor provides
from(bucket: "telegraf/autogen")
  |> range(start: v.timeRangeStart, stop: v.timeRangeStop)
  |> filter(fn: (r) => r._measurement == "minecraft_status")
  |> filter(fn: (r) => r._field == "online")
  |> group(columns: ["host","port"])
  |> aggregateWindow(every: 5m, fn: mean)

Tying all that together, you get a dashboard that gives a good at-a-glance overview of the state of your minecraft server.
Conclusion
It's incredibly easy to get a Minecraft server up and running with Docker (which is, in no small part, thanks to itzg). Monitoring it isn't much harder either.
With Minecraft having split into a number of editions, there are a few additional things that I want to do in future
- Dockerise and run
Geyserso that Bedrock players can connect to the Java Edition server - Dockerise and run
BedrockConnectso that consoles like the Switch can connect to the Java Edition server
But those'll have to wait for now.