Monitoring the Tor daemon with Telegraf
My services have been available via Tor .onion for around 7 years now, but my monitoring of their availability has always been relatively limited. I did previously have smokeping running reachability tests, but other than that there's been a reliance on me noticing that things weren't right (or perhaps receiving reports that an .onion was misbehaving).
Part of the reason for this is that there's never (to my knowledge) been a good centralised way to monitor the health of a Tor install. Nyx is a fantastic command line tool, but relies on the operator logging into their box: it's akin to relying on top to monitor CPU usage.
I've always figured that it should be possible to monitor the tor daemon more effectively, but never really quite got around to do anything about it.
This week, I decided to take a pop at it, and a quick scan over Tor's control port spec revealed how easy it should be to collect stats.
This documentation details how to use my new Tor Daemon Plugin for Telegraf to collect metrics from a Tor daemon.
The full list of statistics collected can be seen in the plugin's README, but they include
-
bytes_rx: total bytes received by Tor -
bytes_tx: total bytes transmitted by Tor -
uptime: Tor daemon uptime -
version_status: Tor's assessment of whether the installed version is OK to use - Accounting information: is a quota set? If so, how much is left?
- Reachability test statuses
- Guard node states
Although my main focus is on monitoring the availability of my onion services, the plugin can be used to monitor tor relays, bridges and exit nodes too.
Pre-Requisites
You will need to install telegraf on your Tor node.
Although Telegraf supports outputting to a wide range of systems, I use InfluxDB so the examples relate to writing data into an InfluxDB upstream.
Configuring Tor
The monitoring plugin uses Tor's ControlPort in order to retrieve statistics, so this needs to be enabled in Tor's configuration.
If you've already got the ControlPort enabled with HashedPassword support, you can skip this section.
To do this, we first generate a password hash (cookie based auth isn't currently supported by the plugin, but may be implemented in future)
tor --hash-password MySuperSecretPassword
# Outputs
# 16:8DED2B1036E04B50603907271DF881ACEA26671AA27411A77830C046F7
Next, we need to update tor's configuration
nano /etc/tor/torrc
Add the following (replace the password digest with your own)
ControlPort 9051
HashedControlPassword 16:8DED2B1036E04B50603907271DF881ACEA26671AA27411A77830C046F7
Save and exit (ctrl-x, y)
Reload tor
pkill -sighup tor
Installing and Configuring the Plugin
Next up is installing and configuring the plugin itself
Clone my plugins repo down and copy the plugin file into /usr/local/bin (you can change the path if you wish)
git clone git@github.com:bentasker/telegraf-plugins.git
sudo cp telegraf-plugins/tor-daemon/tor-daemon.py /usr/local/bin
Open the script in a text editor
sudo nano /usr/local/bin/tor-daemon.py
And edit the variables at the top to set the relevant details for your install (in future, there'll be an easier way to set the config)
CONTROL_H = os.getenv("CONTROL_HOST", "127.0.0.1")
CONTROL_P = int(os.getenv("CONTROL_PORT", 9051))
AUTH = os.getenv("CONTROL_AUTH", "MySecretPass")
Run the plugin to verify that it returns results
/usr/local/bin/tor-daemon.py
You should get some Line Protocol output:
tor,controlport_connection=success,version_status=recommended,network_liveness=up stats_fetch_failures=0i,bytes_rx=239214179i,bytes_rx=280990655i,uptime=35874i,tor_version="0.4.5.10",dormant=0i,orport_reachability=1i,dirport_reachability=1i,guards_never_connected=22i,guards_down=0i,guards_up=0i,guards_unlisted=0i,guards_unusable=0i,guards_total=22i
Add the following TOML to /etc/telegraf/telegraf.conf to configure Telegraf to trigger the plugin
[[inputs.exec]]
commands = ["/usr/local/bin/tor-daemon.py"]
data_format = "influx"
And, if you haven't already, add an output to your telegraf configuration, telling it to write to your InfluxDB instance
[[outputs.influxdb_v2]]
  ## The URLs of the InfluxDB cluster nodes.
  urls = ["https://eu-central-1-1.aws.cloud2.influxdata.com"]

  ## Token for authentication.
  token = "<token>"

  ## Organization is the name of the organization you wish to write to; must exist.
  organization = "<org name>"

  ## Destination bucket to write into.
  bucket = "telegraf"
Restart Telegraf
systemctl restart telegraf
Graphing
You should now have data appearing in InfluxDB, in a measurement called tor within the telegraf bucket.
The next thing to do then is to create a dashboard and graph some of these metrics out (there's an export of the dashboard here).

The top row gives a global overview - are there any nodes which are reporting themselves as dormant, and are there any nodes where the plugin is failing to fetch statistics?
Below that, we add some at-a-glance indicators of Tor's health
Does it consider itself to have a network connection?
from(bucket: "telegraf/autogen")
  |> range(start: v.timeRangeStart, stop: v.timeRangeStop)
  |> filter(fn: (r) => r._measurement == "tor")
  |> filter(fn: (r) => r._field == "bytes_rx")
  |> filter(fn: (r) => r.host == v.host)
  |> last()
  |> map(fn: (r) => ({
      host: r.host,
      _value: if r.network_liveness == "up"
             then
                1
             else
                0
      ,
      _field: "network_liveness"
  }))
How does tor assess it's own software version?
from(bucket: "telegraf/autogen")
  |> range(start: v.timeRangeStart, stop: v.timeRangeStop)
  |> filter(fn: (r) => r._measurement == "tor")
  |> filter(fn: (r) => r._field == "bytes_rx")
  |> filter(fn: (r) => r.host == v.host)
  |> last()
  |> map(fn: (r) => ({
     host: r.host,
     _value:
             if r.version_status == "recommended" or r.version_status == "new" or r.version_status == "new in series"
             then
                // Good to go
                5
             else if r.version_status == "old"
             then
                // might be an issue in future
                3
             else if r.version_status == "unrecommended" or r.version_status == "obsolete"
             then
                // Uhoh
                1
             else
                // Unknown
                7
      ,
     _field: "version_status"
  }))
Is the node currently hibernating because it's reached the configured accounting quotas?
from(bucket: "telegraf/autogen")
  |> range(start: v.timeRangeStart, stop: v.timeRangeStop)
  |> filter(fn: (r) => r._measurement == "tor")
  |> filter(fn: (r) => r._field == "accounting_bytes_read")
  |> filter(fn: (r) => r.host == v.host)
  |> last()
  |> map(fn: (r) => ({
    _value: if r.accounting_hibernating_state == "awake" then
        2
     else if r.accounting_hibernating_state == "soft" then
        4
     else if r.accounting_hibernating_state == "hard" then
        6
     else
        0
  }))
We then present some headline stats
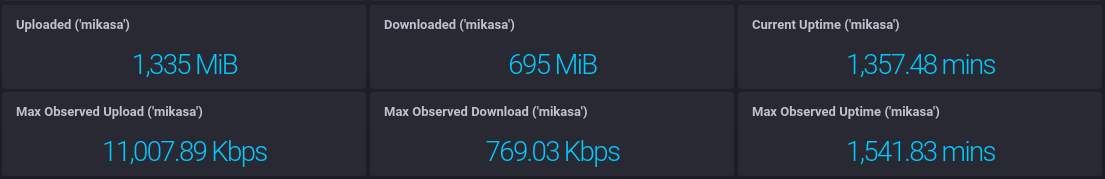
Because bytes sent/received is an incremental counter (and resets at daemon restart), we need to calculate the total increase within the queried time period.
To achieve this, we use difference() to extract the delta between each point, before summing that and using map() to convert from bytes to Mebibytes.
from(bucket: "telegraf/autogen")
  |> range(start: v.timeRangeStart, stop: v.timeRangeStop)
  |> filter(fn: (r) => r._measurement == "tor")
  |> filter(fn: (r) => r._field == "bytes_tx")
  |> filter(fn: (r) => r.host == v.host)
  |> group()
  |> difference()
  |> filter(fn: (r) => r._value > 0)
  |> sum()
  |> map(fn: (r) => ({ r with
      _value: r._value / 1024 / 1024
  }))
The uptime cell doesn't have the same constraint, and can just use last() to get the most recent reading (within the specified time range).
from(bucket: "telegraf/autogen")
  |> range(start: v.timeRangeStart, stop: v.timeRangeStop)
  |> filter(fn: (r) => r._measurement == "tor")
  |> filter(fn: (r) => r._field == "uptime")
  |> filter(fn: (r) => r.host == v.host)
  |> group(columns: ["host", "_field"])
  |> sort(columns: ["_time"])
  |> last()
  |> map(fn: (r) => ({ r with
      _value: float(v: r._value)  / 60.0
  }))
Whilst the cells in the bottom row use max() to get the maximum value observed within the time range
from(bucket: "telegraf/autogen")
  |> range(start: v.timeRangeStart, stop: v.timeRangeStop)
  |> filter(fn: (r) => r._measurement == "tor")
  |> filter(fn: (r) => r._field == "bytes_tx")
  |> filter(fn: (r) => r.host == v.host)
  |> group(columns: ["host", "_field"])
  |> sort(columns: ["_time"])
  |> derivative(unit: 1s, nonNegative: true)
  |> max()
  |> map(fn: (r) => ({ r with
      _value: (r._value * 8.00) / 1000.00
  }))
We can also graph out the node's view of it's guards

from(bucket: "telegraf/autogen")
  |> range(start: v.timeRangeStart)
  |> filter(fn: (r) => r._measurement == "tor")
  |> filter(fn: (r) => r.host == v.host)
  |> filter(fn: (r) => r._field == "guards_down" or
            r._field == "guards_never_connected" or
            r._field == "guards_total" or
            r._field == "guards_unlisted" or
            r._field == "guards_unusable" or
            r._field == "guards_up")
  |>aggregateWindow(every: v.windowPeriod, fn: max)
  |>keep(columns: ["_time","host", "_field", "_value"])
And a view of where the node is in it's accounting period

from(bucket: "telegraf/autogen")
  |> range(start: v.timeRangeStart)
  |> filter(fn: (r) => r._measurement == "tor")
  |> filter(fn: (r) => r._field == "accounting_bytes_read" or r._field == "accounting_bytes_write")
  |> filter(fn: (r) => r.host == v.host)
  |> group(columns: ["host","_field"])
  |> aggregateWindow(every: v.windowPeriod, fn: max)
Active Monitoring
Graphs are useful, but they still rely on the operator checking dashboards and spotting issues.
For active alerting, we can link Kapacitor to an InfluxDB install and proactively monitor Tor's state using that.
For example, if we want to alert when a node is approaching its accounting quota:
var message = '{{ .ID }}:  remaining Tor quota on {{ index .Tags "host"}} is {{ .Level }}'

var name = 'Tor write quota'

var idVar = name

var details = message


var data = stream
    |from()
        .database('telegraf')
        .retentionPolicy('autogen')
        .measurement('tor')
        .groupBy(['host'])
        .where(lambda: isPresent("accounting_bytes_remaining_write"))
    |eval(lambda: "accounting_bytes_remaining_write")
        .as('value')

var trigger = data
    |alert()
        .crit(lambda: "value" < 104857600)
        .message(message)
        .id(idVar)
        .idTag('alertID')
        .levelTag('level')
        .messageField('message')
        .durationField('duration')
        .details(details)
        .stateChangesOnly()
        .email()
This will send an email if the tor node's remaining write quota is less than 100MiB
We can alert on any metric written into the database, but we might also want to alert on a lack of metrics.
To do this, we create a deadman check:
var message = '{{ .ID }}: Tor daemon on {{index .Tags "host"}} is {{ .Level }}'

var details = message

var name = 'tor deadman'

var idVar = name + '-{{.Group}}'

var data = stream
    |from()
        .database('telegraf')
        .retentionPolicy('autogen')
        .measurement('tor')
        .groupBy(['host'])

var trigger = data
    |deadman(0.0, 30m)
        .stateChangesOnly()
        .message(message)
        .id(idVar)
        .idTag('alertID')
        .levelTag('level')
        .messageField('message')
        .durationField('duration')
        .details(details)
        .email()
This will send an email alert if no tor metrics are received from the Tor node for 30 minutes.
Conclusion
The plugin is currently fairly simple: there are exit-specific stats that it doesn't currently collect (I need to set an exit up to check how best to collect them) and only one authentication mechanism is currently supported.
But, it allows collection of tor related statistics into a central location, enabling active notification of service interruptions as well as providing information which can be used for planning and scaling.