Monitoring eepsite availability with Telegraf
I've been doing some work making bentasker.co.uk available via I2P. A core part of that is setting up monitoring so that I can see when things are going wrong (or starting to).
I previously documented the process of monitoring the I2PD daemon with Telegraf. Whilst daemon monitoring is important, it only tells us about the state of the daemon, it tells us little about an eepsite's reachability and performance.
This documentation details how to use Telegraf to perform reachability checks against an I2P eepsite.
Requirements
You'll need somewhere to run checks from. You can't run the checks on the server hosting your eepsite as you won't get a view of the state of network connectivity.
You'll also need something to write the monitoring data into - I use InfluxDB, you can do the same with a free Influxcloud account.
Setting up
Our monitoring box needs to run two things: Telegraf and an I2P client.
I use i2pd but you can just as easily use the Java I2P client - the only requirement is that your client needs to expose a HTTP proxy for Telegraf to use.
For ease of example, we'll use docker to run both.
Create a network for the containers to use
docker network create i2p-monitoring
Start i2pd
docker run -d --name=i2p \
-h i2p \
-v i2p-client:/home/i2pd/data \
--restart=unless-stopped \
--network=i2p-monitoring \
purplei2p/i2pd
We've not exposed the HTTP proxy port (TCP 4444) because we're going to use docker networking to connect to it.
Next we need to create some configuration for Telegraf, save the following as telegraf.conf (editing the bits that you need to)
[agent]
interval = "1m"
round_interval = true

metric_batch_size = 1000
metric_buffer_limit = 10000
collection_jitter = "0s"

flush_interval = "10s"
flush_jitter = "0s"

precision = ""

debug = true
quiet = true

logfile = ""

hostname = ""
omit_hostname = false

[[inputs.http_response]]
    # Provide your eepsite URLs here
    urls = ["http://bentasker.i2p",
            "http://snippets.bentasker.i2p",
            "http://bapmqkdc7xotvlym3bj75gdb4tlgg2poezkmz36w64qum4racpyq.b32.i2p",
            "http://5es4aj6pfdxoz6oz6vbcczix25dlfelrdav6a6hw7tuudb7kxwba.b32.i2p",
            "http://bapmqkdc7xotvlym3bj75gdb4tlgg2poezkmz36w64qum4racpyq.b32.i2p"
            ]

    http_proxy = "http://i2p:4444"

    response_timeout = "20s"
    method = "GET"
    response_status_code = 200

[[outputs.influxdb_v2]]
    urls = ["https://eu-central-1-1.aws.cloud2.influxdata.com"]

    ## Token for authentication.
    token = "$INFLUX_TOKEN"

    ## Organization is the name of the organization you wish to write to; must exist.
    organization = "$INFLUX_ORG"

    ## Destination bucket to write into.
    bucket = "telegraf"
If you want to fetch a specific file/path rather than the home page, include it in the URLs.
Now, we just need to fire Telegraf up
docker run -d \
--name telegraf \
-h telegraf-$HOSTNAME \
--restart unless-stopped \
-e INFLUX_TOKEN="<your api token>" \
-e INFLUX_ORG="<your org name>" \
--network=i2p-monitoring \
-v $PWD/telegraf.conf:/etc/telegraf/telegraf.conf \
telegraf
Telegraf will start up and once a minute will place a request to the eepsites that you've defined.
The resulting line protocol looks like this
http_response,host=optimus,method=GET,result=success,server=http://bentasker.i2p,status_code=200 response_time=1.434499073,http_response_code=200i,content_length=31635i,response_status_code_match=1i,result_type="success",result_code=0i 1647592622000000000
http_response,host=optimus,method=GET,result=success,server=http://snippets.bentasker.i2p,status_code=200 response_time=1.582512412,http_response_code=200i,content_length=7869i,response_status_code_match=1i,result_type="success",result_code=0i 1647592624000000000
http_response,host=optimus,method=GET,result=success,server=http://bapmqkdc7xotvlym3bj75gdb4tlgg2poezkmz36w64qum4racpyq.b32.i2p,status_code=200 http_response_code=200i,content_length=0i,response_status_code_match=1i,result_type="success",result_code=0i,response_time=1.8132161660000001 1647592626000000000
http_response,host=optimus,method=GET,result=success,server=http://5es4aj6pfdxoz6oz6vbcczix25dlfelrdav6a6hw7tuudb7kxwba.b32.i2p,status_code=200 http_response_code=200i,content_length=2498i,response_status_code_match=1i,result_type="success",result_code=0i,response_time=2.866303381 1647592629000000000
http_response,host=optimus,method=GET,result=success,server=http://bapmqkdc7xotvlym3bj75gdb4tlgg2poezkmz36w64qum4racpyq.b32.i2p,status_code=200 response_time=0.758986904,http_response_code=200i,content_length=0i,response_status_code_match=1i,result_type="success",result_code=0i 1647592629000000000
The meaning of these can be found in the plugin's README.
Note that if you're using an shortname, it will likely initially report as down for a while because the I2P client needs to update it's addressbook before it'll be able to resolve those names.
Dashboard
With the checks in place, we can then start building a dashboard.
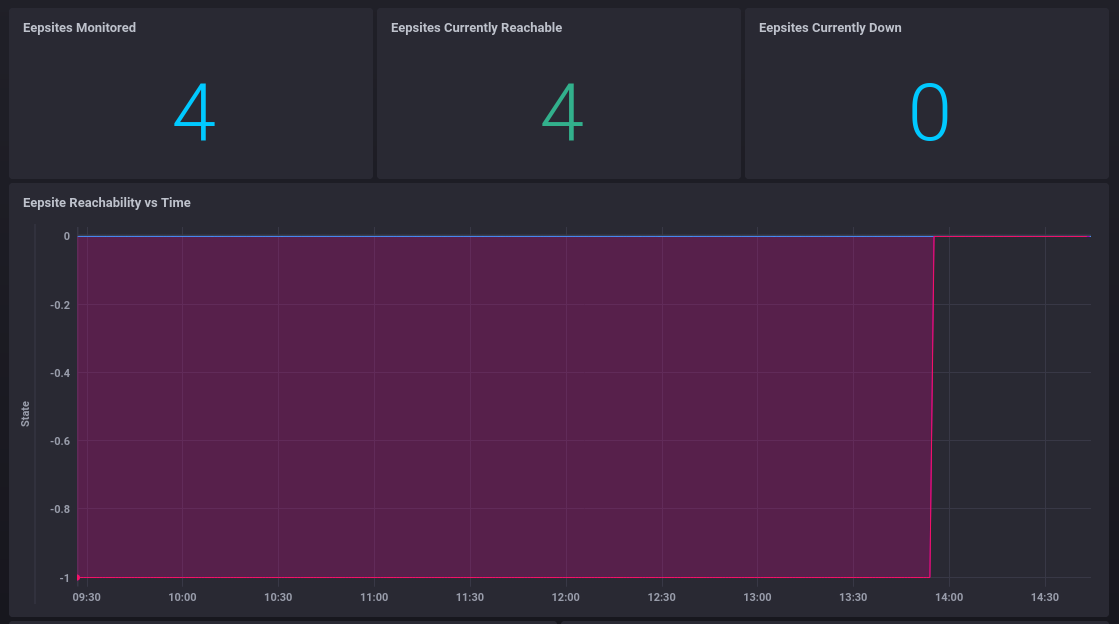
The most important (IMO) stat on the dashboard is whether an eepsite has remained reachable or not, so there are a couple of representations of that
This Flux tells us how many eepsites were considered down on the last check
from(bucket: "telegraf/autogen")
  |> range(start: v.timeRangeStart)
  |> filter(fn: (r) => r._measurement == "http_response")
  |> filter(fn: (r) => r._field == "response_status_code_match")
  |> group(columns: ["server"])
  |> last()
  |> map(fn: (r) => ({ r with _value: if r._value == 0 then 1 else 0 }))
  |> group()
  |> sum()
Similar Flux is then used show reachable (if r._value ==) and a total count (skip the map())
We can graph out reachability over time with the following
from(bucket: "telegraf/autogen")
  |> range(start: v.timeRangeStart)
  |> filter(fn: (r) => r._measurement == "http_response")
  |> filter(fn: (r) => r._field == "response_status_code_match")
  |> map(fn: (r) => ({
       _time: r._time,
       _value: r._value - 1,
       server: r.server
  }))
  |> aggregateWindow(every: v.windowPeriod, fn: min)
This takes the value of response_status_code_match and inverts it from being 0 and 1 to 0 and -1, so that stuff going down causes the graph to go negative. If the graph doesn't render as a single set of lines, then something's down or been down.
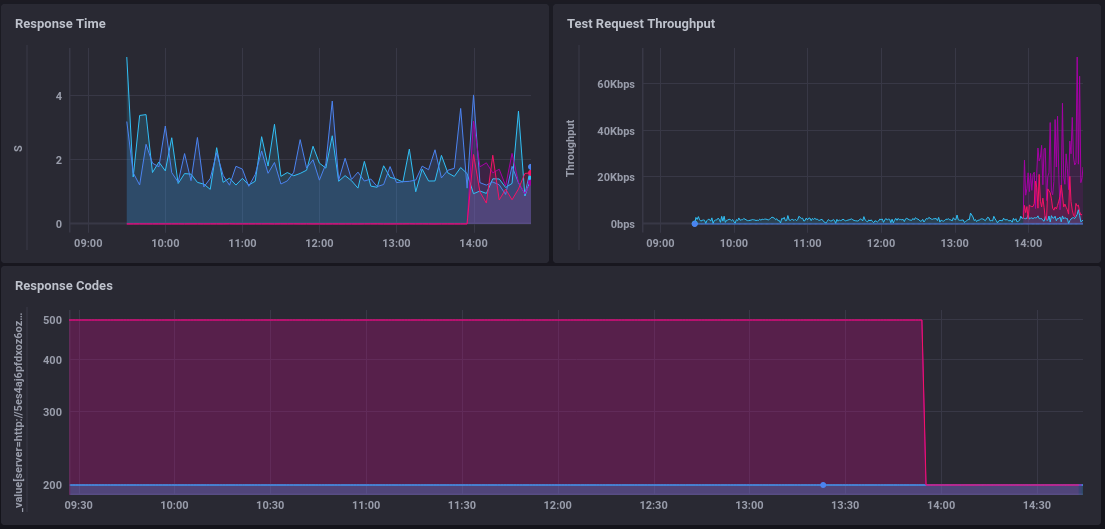
Graphing out response times is even easier
from(bucket: "telegraf/autogen")
  |> range(start: v.timeRangeStart)
  |> filter(fn: (r) => r._measurement == "http_response")
  |> filter(fn: (r) => r._field == "response_time")
  |> keep(columns: ["_time","_value","server","http_response_code"])
  |> aggregateWindow(every: v.windowPeriod, fn: mean)
For something a little more advanced, we can also check the average delivery speed of those test requests by using the content-length and the response time
from(bucket: "telegraf/autogen")
  |> range(start: v.timeRangeStart)
  |> filter(fn: (r) => r._measurement == "http_response")
  |> filter(fn: (r) => r._field == "response_time" or r._field == "content_length")
  |> filter(fn: (r) => r.status_code == "200")
  |> pivot(rowKey:["_time"], columnKey: ["_field"], valueColumn: "_value")
  |> map(fn: (r) => ({
     _time: r._time,
     _field: "avg_throughput",
     _value: float(v: r.content_length) / r.response_time,
     server: r.server,
     status_code: r.status_code
  }))
  |> aggregateWindow(every: v.windowPeriod, fn: mean)
It's worth noting, though, that unless you're serving a large file you'll never see huge speeds in this graph as there just isn't time for it to ramp up.
Alerts
Of course, graphs are only one part of a monitoring solution - it's also useful to have alerts.
The following TICKscript will have kapacitor email me when eepsite's have been down for a minute, and again when they've been down 5 minutes, with a final email on recovery
var db = 'telegraf'

var rp = 'autogen'

var measurement = 'http_response'

var groupBy = ['server']

var whereFilter = lambda: isPresent("response_status_code_match")

var name = 'Eepsite reachability'

var idVar = 'Eepsite reachability {{ index .Tags "server" }}'

var message = ' {{.ID}} is {{.Level}} for {{ index .Tags "server" }}'

var idTag = 'alertID'

var levelTag = 'level'

var messageField = 'message'

var durationField = 'duration'

var outputDB = 'chronograf'

var outputRP = 'autogen'

var outputMeasurement = 'alerts'

var triggerType = 'threshold'

var details = 'Eepsite down monitoring notication for {{ index .Tags "server" }}<br />
<br />
<b>Server:</b> {{ index .Tags "server" }}<br />
<b>State:</b> {{.Level}}<br />
<b>Duration:</b> {{index .Fields "state_duration"}} minutes<br />
<b>Status Code:</b> {{ index .Tags "status_code" }}<br />
<br />

'


var data = stream
    |from()
        .database(db)
        .retentionPolicy(rp)
        .measurement(measurement)
        .groupBy(groupBy)
        .where(whereFilter)
    |eval(lambda: "response_status_code_match")
        .as('value')
    |stateDuration(lambda: "value" < 1)
        .unit(1m)

var trigger = data
    |alert()
        .warn(lambda: "state_duration" >= 1)
        .crit(lambda: "state_duration" >= 5)
        .stateChangesOnly()
        .message(message)
        .id(idVar)
        .idTag(idTag)
        .levelTag(levelTag)
        .messageField(messageField)
        .durationField(durationField)
        .details(details)
        .email()

trigger
    |eval(lambda: float("value"))
        .as('value')
        .keep()
    |influxDBOut()
        .create()
        .database(outputDB)
        .retentionPolicy(outputRP)
        .measurement(outputMeasurement)
        .tag('alertName', name)
        .tag('triggerType', triggerType)

trigger
    |httpOut('output')
The result is an email like this
Eepsite down monitoring notication for http://5es4aj6pfdxoz6oz6vbcczix25dlfelrdav6a6hw7tuudb7kxwba.b32.i2p

Server: http://5es4aj6pfdxoz6oz6vbcczix25dlfelrdav6a6hw7tuudb7kxwba.b32.i2p
State: CRITICAL
Duration: 5.683333333333334 minutes
Status Code: 500
Conclusion
Monitoring an eepsite's availability isn't really any harder than monitoring availability for a clearnet site - you just need to run an I2P client for Telegraf to use as a HTTP proxy.
The example given here is fairly simplistic - depending on your needs, you might want to run Telegraf and I2PD in distinct geographic locations so that your monitoring can account for localised issues.