Tracking my remaining AAISP Data Quota with Telegraf
Some time back, I switched our internet connection over from BT to Andrews & Arnold. Although the quality and reliability of our service has improved immensely, it does mean I've had to get used to us having a quota (generous though it is) rather than being "Unlimited".
AAISP make checking this pretty easy - you can simply go to their homepage and it'll display there.
However, they also expose a JSON API to check it
curl -s -L https://quota.aa.net.uk --header "Accept: application/json" | jq
{
  "monthly_quota": 5000000000000,
  "monthly_quota_gb": 5000,
  "quota_remaining": 9026529201951,
  "quota_remaining_gb": 9026,
  "quota_status": "green"
}
(AAISP let you roll over half of your unused each month, which is why quota_remaining is higher than monthly_quota)
So I wanted to configure Telegraf to poll this periodically and write it into InfluxDB.
This post details the steps I followed
Telegraf has the ability to fetch and parse arbitrary JSON so this was actually fairly straightforward to set up.
I configured the inputs.http plugin to go out and fetch the JSON, and then pass that into the JSON parser:
[[inputs.http]]
    urls = ["https://quota.aa.net.uk"]
    headers = {"Accept" =  "application/json"}
    tagexclude = ["url", "host"]
    data_format = "json_v2"
    [[inputs.http.json_v2]]
        measurement_name = "data_quota"
    [[inputs.http.json_v2.field]]
        path = "quota_remaining_gb"
        type = "int"
    [[inputs.http.json_v2.field]]
        path = "monthly_quota_gb"
        type = "int"
    [[inputs.http.json_v2.field]]
        path = "quota_remaining"
        type = "int"
(I didn't bother collecting monthly_quota or quota_status as I didn't see a need for them).
Telegraf starting collecting the data and writing it into InfluxDB, so the next step was graphing in Chronograf
We can graph out remaining quota with the following flux
from(bucket: "telegraf/autogen")
  |> range(start: v.timeRangeStart)
  |> filter(fn: (r) => r._measurement == "data_quota")
  |> filter(fn: (r) => r._field == "quota_remaining")
  |> filter(fn: (r) => r.measured_from == "gateway_monitor")
  |> aggregateWindow(every: 1h, fn: mean)
  |> map(fn: (r) => ({r with _value: r._value / 1000000000.00}))
  |> group(columns: ["_time", "_start", "_stop", "_value"], mode: "except")
We group by an hour because that's how often the value updates.
With a large filecopy left running to help test, we then get a graph like this:
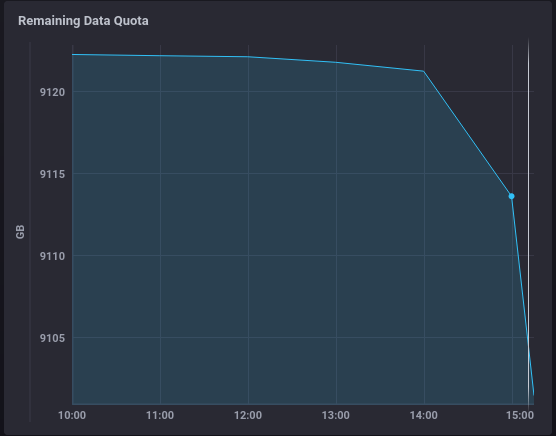
As it turns out, our quota is a lot higher than I remembered, but I can now add alerting in Kapacitor if we ever are somehow in danger of exhausting it.