Monitoring an Aquarium with InfluxDB and Grafana
I've been setting up a new tropical fish tank and wanted to add some monitoring and alerting because, well, why not?
The key questions that I was interested in answering were
- Is the filter running properly?
- Is the temperature within acceptable bounds?
- Are scheduled things (like the surface skimmer and lights) actually happening?
- Are both heaters working?
The plan is to also add monitoring for PH levels, but the probe that I need for that hasn't arrived yet.
In this post I'll talk about the aquarium monitoring and alerting system that I've built using a Raspberry Pi, InfluxDB, Telegraf and Grafana.
Metrics Sources
Some elements of tank health can be monitored via the metrics exposed by my existing energy usage tracking implementation which allow us to see which components are drawing power (and how much/when).
All I needed to do for this was plug things like heaters into smart sockets and add them to the config consumed by my docker image:
kasa:
    devices:
        # ... etc ...
        -
            name: "aquarium-light"
            ip: 192.168.5.165

        -
            name: "aquarium-surface-skimmer"
            ip: 192.168.5.166
        # ... etc ...
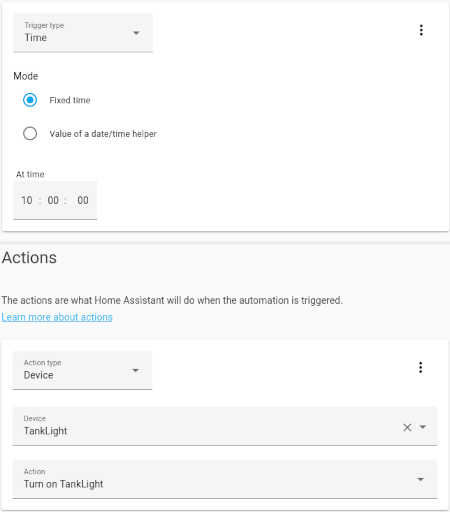
The use of smart sockets also means that HomeAssistant can be used as a timer to schedule runs of things like the surface skimmer and the aquarium light:
Watching power consumption on it's own isn't enough because some of the metrics that we care about require physical measurements to be taken.
For example, watching the energy consumption of the pump is only part of the solution: if the impeller were to fail, the motor would continue drawing power whilst spinning uselessly. There are many failure modes for an aquarium filter, and motor failure is just one, what we actually care about is the flow rate that the pump is achieving.
So, we need some sensors:
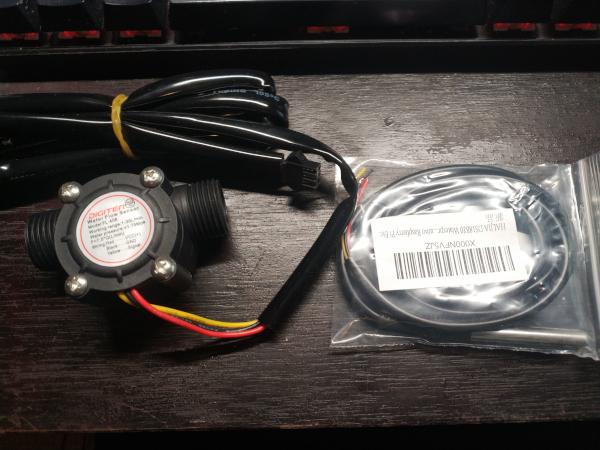
The sensors used are
- A DS18B20 based temperature probe (a 1-wire device)
- A Digitem FL-408 Water Flow Meter
Obviously, the future PH monitoring project will also require a physical probe of its own.
A Note on Temperature Sensors
If you're planning on building something similar, it's worth noting here that it's very important to buy your temperature probe from a reputable vendor (like RS Components). There are a lot of fake DS18B20 chips about and they tend to misbehave in annoying and unpredictable ways.
The temperature sensor shown in the image above was ordered from Amazon and seemed to work fine at first. However, after about 6 hours of operation it developed a habit of dropping off the bus entirely, not re-appearing unless the Pi was fully power-cycled.
This behaviour, apparently, is not uncommon amongst dodgy chips. They're also known to return some very suspect readings:
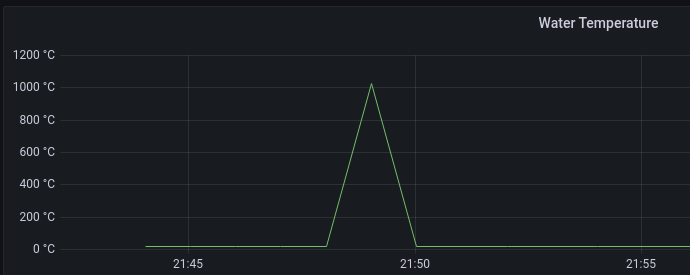
That's right, if the probe is to be believed, then (in a matter of moments) my tank went from ~20c to 3x water's critical temperature...
Once I became aware of the issue, I ordered a replacement probe from DSRobot. It even managed to be cheaper than the original: knock-offs don't just exist at the bottom end of the price range.
Raspberry Pi Build
I had a spare Raspberry Pi 4 that had sat unused since it's SD card failed (I migrated stuff elsewhere at the time), so I decided to use that. In theory though, any GPIO equipped single board computer should work.
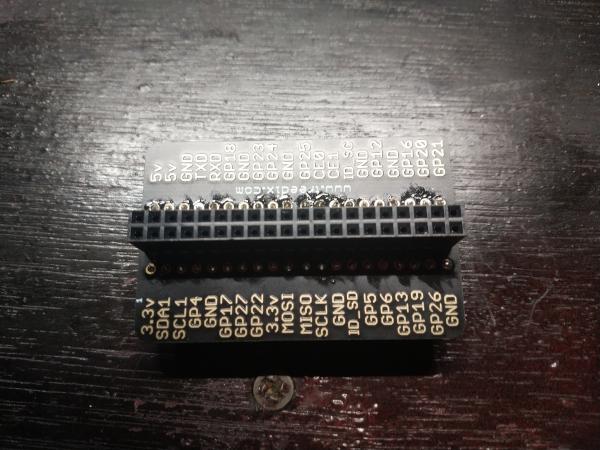
For convenience's sake, I ordered a GPIO break-out board with screw terminals.
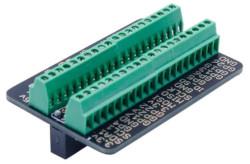
It turned out, though, that this was not actually that convenient a route, because what turned up was a board and a set of connectors with not a drop of solder in sight.
The manufacturer presumably had had a conversation along the following lines
Pers 1: Should we provide these pre-assembled?
Pers 2: It'll mean using solder, that costs money
Pers 1: Customers will expect it to work though and they probably have a project they want to get moving on
Pers 2: No, these people are hobbyists they love soldering. We'll be giving them more of what they enjoy and they'll love us for it
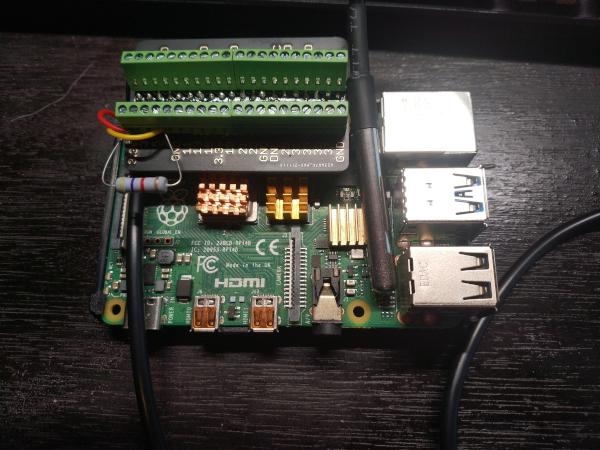
So, with some grumbling, I took my "convenient" board and soldered the connectors onto it. This didn't go particularly well because I'd had a conversation of my own
Me: Where the F@!# is my good soldering iron?
Me: the gas powered one will have to do
Me: Oh, it's only got a fat tip... better than nothing
Me: Which **** didn't order replacement solder the last time I nearly finished it all up?
It turns out (surprising no-one) that delicate soldering can be a bit of a challenge when you're having to compete with an unweildy soldering iron which is heating a big fat tip and blowing hot exhaust out over fingers that are trying to hold onto an unnecessarily short length of solder.
It might just be the worst bit of soldering I've ever done, but solder it I did:
(No, I'm not being self-deprecating, you haven't seen the other side)
With my newly soldered breakout board in hand, it was time to connect the sensors.
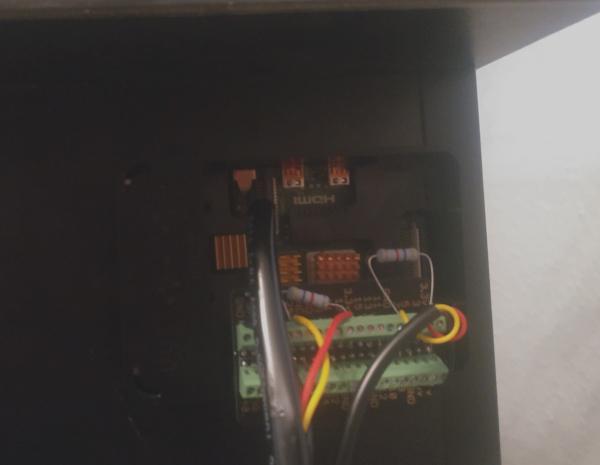
The temperature probe came first, wiring as follows
- VCC (red) to pin 1 (3.3v supply)
- Signal (yellow) to pin 7 (GPIO 4)
- Ground (black) to pin 6 (GND)
- 4.7k resistor between Pin 1 and 7
Next was the water flow meter
- VCC (red) to pin 17 (3.3v supply)
- Signal (yellow) to pin 29 (GPIO 5)
- Ground (black) to pin 39 (GND)
- 4.7k resistor between Pin 17 and 29
With the hardware connected, I moved onto kicking together some code to collect and submit readings.
Collecting Readings
The two sensors are accessible in different ways. I could have built a more graceful implementation, using a single script to collect readings from both, but opted not to - in part because I wanted to poll at entirely different intervals.
Full copies of the scripts referred to below are available on Github.
Temperature Sensor
The temperature sensor presents a 1-wire bus device which can simply be read from:
$ cat /sys/bus/w1/devices/28-3c6df6482d24/w1_slave
5a 01 55 05 7f a5 a5 66 c3 : crc=c3 YES
5a 01 55 05 7f a5 a5 66 c3 t=21625
In the output above, the sensor is reporting 21.63 degrees celsius.
28-3c6df6482d24 is the serial number of the chip in the probe (with the benefit of hindsight, it also tells us that there's a good chance that the chip is a knock-off).
Because the probe can be read using cat, collecting and submitting readings from it is very simple
#!/bin/bash
#
# Read temperature from a 1-wire temperature sensor
#
# example: ./read_temperature.sh <dev name>
#
# Copyright (c) 2023 B Tasker
# Released under BSD 3-Clause
# https://www.bentasker.co.uk/pages/licenses/bsd-3-clause.html
#
DEVNAME=${1:-"28-3c6df6482d24"}
LOCATION=${LOCATION:-"diningroom"}

# Read the sensor
ts=`date +'%s'`
tempread=`cat /sys/bus/w1/devices/$DEVNAME/w1_slave`
temp=`echo "scale=2; "\`echo ${tempread##*=}\`" / 1000" | bc`

# Build line protocol
lp="aquarium,location=$LOCATION water_temperature=$temp $ts"

# Write the stats out
curl -s -d "$lp" "http://127.0.0.1:8086/write?db=telegraf&precision=s"
I copied the script over to the Pi and added a crontab entry to call it every minute
* * * * * pi /home/pi/tank-monitoring-scripts/app/read_temperature.sh
Water-Flow meter
The water-flow meter required a little more effort, because the OS doesn't helpfully expose an interface for us to cat.
The sensor itself is quite simple, consisting of a turbine (turned by the water passing through) and a hall-effect sensor (to pick up the turbine's rotation).
As the turbine spins, the sensor sends pulses down the wire to the GPIO pin, so we need to count those pulses and then convert them into a flow-rate (e.g. litres per hour).
At it's simplest, the counting could look something like this
#!/usr/bin/env python3
#
# Copyright (c) 2023 B Tasker
# Released under BSD 3-Clause
# https://www.bentasker.co.uk/pages/licenses/bsd-3-clause.html
#
import RPi.GPIO as GPIO

def countPulse(channel):
    ''' Callback function for the GPIO event
    Increment the counter, assuming the counter is active
    '''
    global counter
    if start_counter == 1:
        counter += 1


global counter
counter = 0

GPIO.setmode(GPIO.BCM)
GPIO.setup(GPIO_NUM, GPIO.IN, pull_up_down = GPIO.PUD_UP)
GPIO.add_event_detect(GPIO_NUM, GPIO.FALLING, callback=countPulse)
Obviously we need something to read the value of counter. But, it also needs to convert the count over to a flowrate.
The label on the sensor tells us how to perform that conversion:
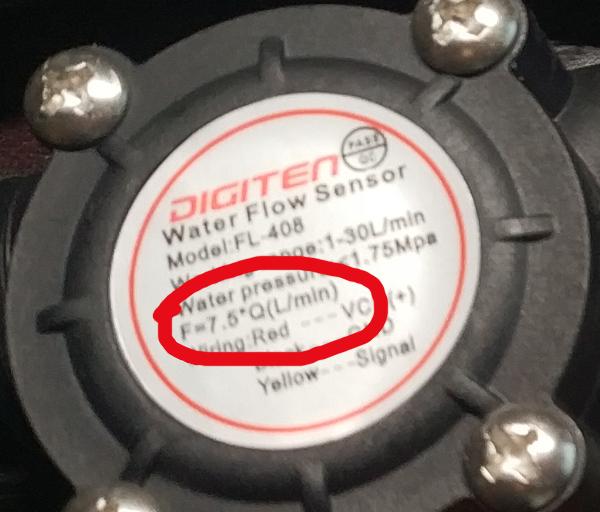
The annotation F=7.5*Q(L/min) says that every 7.5 blips is equivalent to a rate of 1L/min.
This means that the maths that we need to perform is quite simple: count pulses for a second and then divide the count by 7.5 to get a rate in litres per minute.
# We use this list to track rates between writes
flowrates = []

while True:
    try:
        # Capture some pulses
        start_counter = 1
        time.sleep(1)
        start_counter = 0

        # Calculate the flow rate
        # Pulse frequency (Hz) = 7.5Q, Q is flow rate in L/min.
        flow = (counter / 7.5)

        # Add to the list of observed rates
        flowrates.append(flow)

        counter = 0
        time.sleep(5)
Every iteration a flow-rate is calculated and pushed into the list flowrates.
5 seconds is a far more regular a reading than I really need to submit, but I wanted to take those regular readings and periodically aggregate them before writing out to InfluxDB:
# We use this list to track rates between writes
flowrates = []

while True:
    try:
        # Capture some pulses
        start_counter = 1
        time.sleep(1)
        start_counter = 0

        # Calculate the flow rate
        flow = (counter / 7.5) # Pulse frequency (Hz) = 7.5Q, Q is flow rate in L/min.

        # Add to the list of rates
        flowrates.append(flow)

        # Write out
        if len(flowrates) >= 4:
            # Calculate bounds and average
            stats = {
                "min" : min(flowrates),
                "max" : max(flowrates),
                "mean" : sum(flowrates) / len(flowrates)
            }
            writeStat(stats, session)
            flowrates = []

        counter = 0
        time.sleep(5)
Now, the script periodically writes out the mean, min and max flowrate for that sampling interval.
After tidying the script up a bit, I was ready to deploy it, so copied it over to the Pi and created a unit file
[Unit]
Description=FlowRate Monitor
After=multi-user.target

[Service]
Type=simple
ExecStart=/home/pi/tank-monitoring-scripts/app/read_flowrate.py
Restart=on-failure

[Install]
WantedBy=multi-user.target
I then installed, enabled and started it
sudo -s
cp flowrate.service /etc/systemd/system/
systemctl daemon-reload
systemctl enable flowrate
systemctl start flowrate
Collecting with Telegraf
Whilst both scripts could write directly into my InfluxDB instance, neither script implements a write buffer, so if my Influx instance were to be unavailable (whether because it's down or because the tank Pi had Wifi problems) those writes would be lost. Probably not the end of the world, but also far from ideal.
Adding a buffer to the Python script would be easy, the InfluxDB Python Client library supports batched writes, however adding it to the BASH script wouldn't be nearly so straightforward. In either case, if the script had to be restarted, buffered writes would be lost - not ideal considering how little effort I've really put into writing them.
So, I decided to have the scripts instead write into Telegraf's InfluxDB_Listener Input Plugin so that it could provide a buffer against downstream failures. As an additional positive benefit, it also allows collection of system metrics to help monitor the Pi itself.
I'm running Telegraf in docker (because I'd originally intended to dockerise the collection scripts, but have since decided they're too simple to really be worth the effort).
Telegraf is launched from the following docker-compose.yml:
version: '3.1'

services:
    telegraf:
         image: telegraf
         restart: always
         user: telegraf:995
         container_name: telegraf
         network_mode: "host"
         environment:
            HOST_ETC: /hostfs/etc
            HOST_PROC: /hostfs/proc
            HOST_SYS: /hostfs/sys
            HOST_VAR: /hostfs/var
            HOST_RUN: /hostfs/run
            HOST_MOUNT_PREFIX: /hostfs
         ports:
            - 8086:8086
         volumes:
            - /home/pi/tank-monitoring-scripts/config/telegraf/telegraf.conf:/etc/telegraf/telegraf.conf
            - /var/run/docker.sock:/var/run/docker.sock
            - /:/hostfs:ro
Telegraf's config file contains the following
[agent]
  interval = "1m"
  round_interval = true
  metric_batch_size = 1000
  metric_buffer_limit = 10000
  flush_interval = "10s"
  flush_jitter = "0s"
  debug = false
  quiet = true
  hostname = "tankmonitor"
  omit_hostname = false

[[inputs.cpu]]
[[inputs.diskio]]
[[inputs.mem]]
[[inputs.net]]
[[inputs.processes]]
[[inputs.swap]]
[[inputs.system]]

[[inputs.disk]]
  ignore_fs = ["tmpfs", "devtmpfs", "devfs", "overlay", "aufs", "squashfs"]

# Add the listener
[[inputs.influxdb_listener]]
  service_address = "127.0.0.1:8086"

# Send it all to the local InfluxDB instance
[[outputs.influxdb]]
  urls = ["http://192.168.3.84:8086"]
  database = "telegraf"
Starting Telegraf is as simple as
docker-compose up -d
The monitoring scripts can then simply write line protocol into http://127.0.0.1:8086/write as if they were talking to an InfluxDB 1.x instance.
Hardware Installation
With the sensors up and working, it was time to connect it all to the tank.
The water flow meter needed to be connected into the filter circuit. It needs to be plumbed into the return flow pipe and not the feed: not only might it get gummed up by unfiltered crud, but we also want to know that the water is actually getting back to the tank rather than (say) leaking from the cannister.
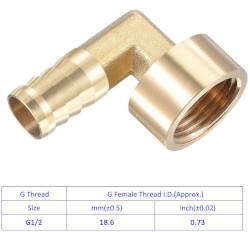
The flow-meter has G1/2 screw threads, so I used a pair of 16mm barb to G1/2 connectors
I ran into a couple of small issues here:
- The connectors arrived without washers
- The tubing for my filter, despite being 20mm externally has a 15mm inner bore (not the more standard 16mm)
The first was a matter of either patience (ordering some o-rings) or sealant (which I had on hand), the second simply required a bit of elbow grease.
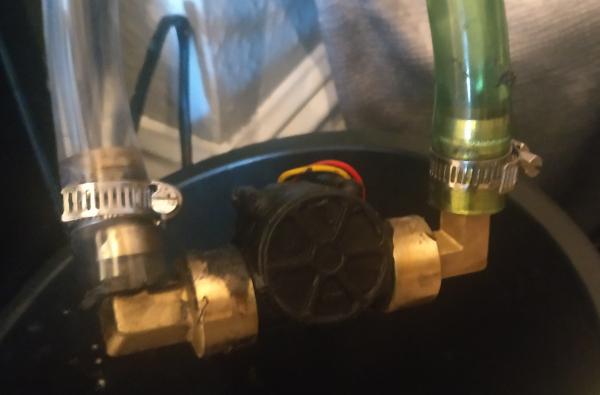
Although seemingly well connected and water-tight, it's still a join and so gets to live in a bucket until I learn to trust it (or, at least, until I next need the bucket).
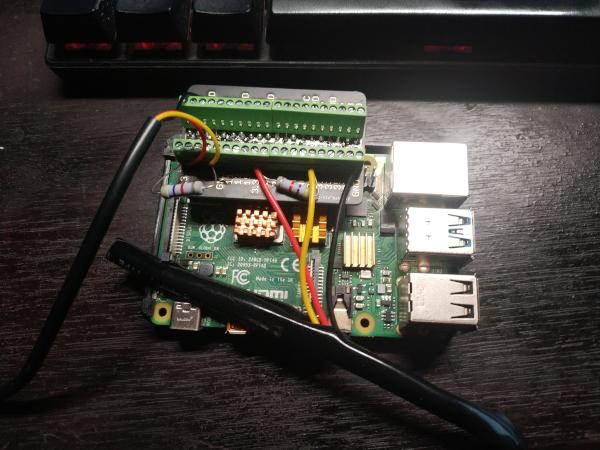
Next up was mounting the Pi itself: I screwed the base of its case to the tank's cabinet, making sure it was positioned under an overhang (to help protect against wayward drips)
Finally, the temperature sensor needed to be put into place, I used a wire tie (like those you might use on a freezer bag) to attach it to suckered hook and then installed it in the tank
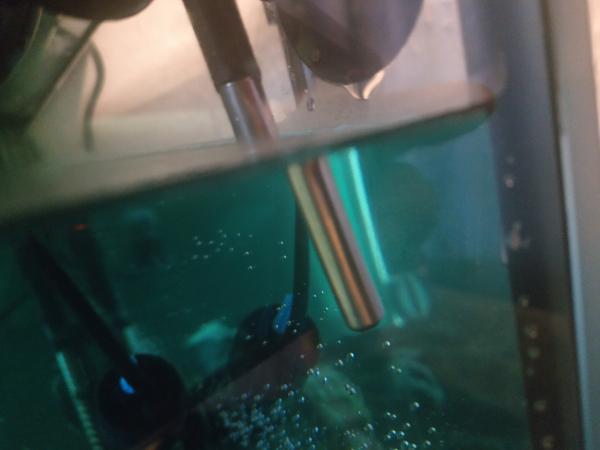
I've since ordered some suckers with clips intended to carry aquarium air lines - the clip is the perfect diameter for the sensor and looks much tidier than a wire tie.
With everything connected and in place, I plugged the Pi's power supply in and within a minute, readings started arriving in InfluxDB.
Graphing
With readings coming into the database, the next thing to do was to build a dashboard in Grafana to allow visualisation of that data:
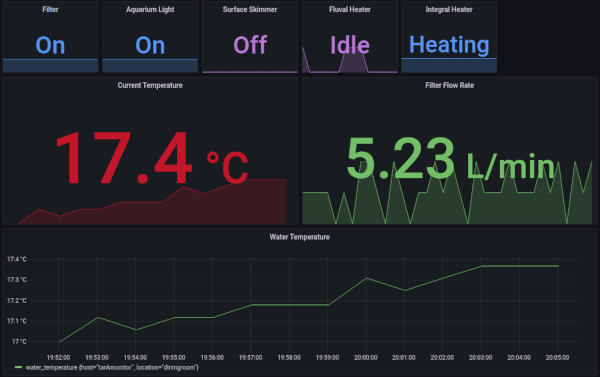
The gap at the top right will contain PH information once the probe arrives.
There's nothing particularly special about the underlying queries, the state indicators at the top simply query consumption and assess whether it's over a threshold
from(bucket: "Systemstats/autogen")
  |> range(start: v.timeRangeStart, stop: v.timeRangeStop)
  |> filter(fn: (r) => r._measurement == "power_watts")
  |> filter(fn: (r) => r._field == "consumption")
  |> filter(fn: (r) => r.host == "aquarium-filter-pump")
  |> aggregateWindow(every: v.windowPeriod, fn: last)
  |> map(fn: (r) => ({Device: r.host,
     _state: if r._value > 9 then
        1
      else
        0
  }))
The pump only uses 10 watts when active, so we check if it's consuming more than 9 to confirm that it's actually turned on.
The flow rate indicator just pulls the mean over time:
from(bucket: "telegraf")
  |> range(start: v.timeRangeStart, stop: v.timeRangeStop)
  |> filter(fn: (r) => r._measurement == "aquarium")
  |> filter(fn: (r) => r._field == "flow_mean")
  |> aggregateWindow(every: v.windowPeriod, fn: last)
There's a graph further down the page which shows how the flow-rate bounds vary over time
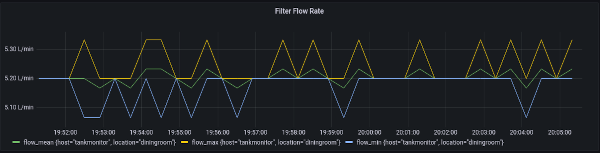
The relative consistency of the differences between them is probably reflective of a sampling issue rather than real fluctuations in the pump rate. What we really care about, though, is that water is being pumped at a relatively consistent rate.
Alerting
I wanted to play around with Grafana's inbuilt alerting, so after adding SMTP details to grafana.ini I added myself as a Contact Point and then proceeded to create a simple alert.
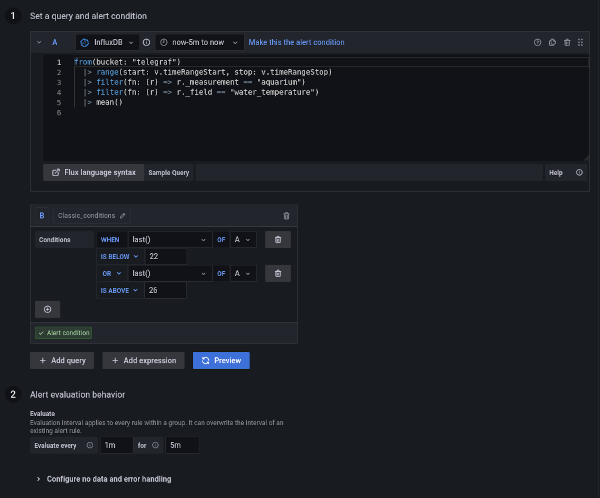
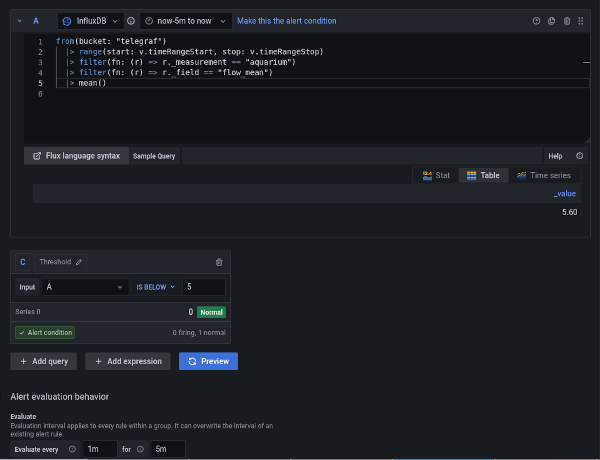
The query used for the alert is
from(bucket: "telegraf")
  |> range(start: v.timeRangeStart, stop: v.timeRangeStop)
  |> filter(fn: (r) => r._measurement == "aquarium")
  |> filter(fn: (r) => r._field == "water_temperature")
  |> mean()
The alert simply calculates the average reported water temperature over the last 5 minutes and sends an notification if it's not between 22 and 26 (many tropical fish will actually tolerate 20-28C, but these tighter thresholds allow time to respond before the fish get too stressed).
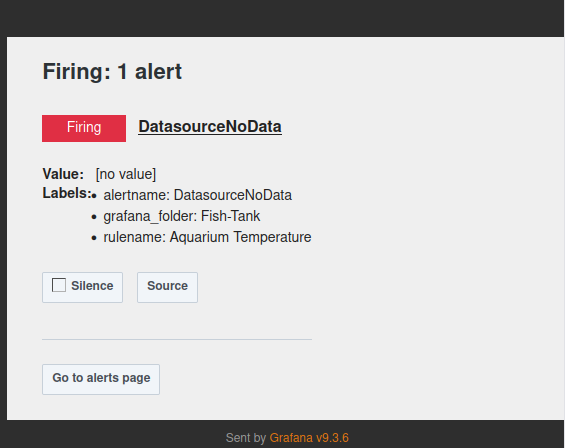
When the alert fires, an email is sent
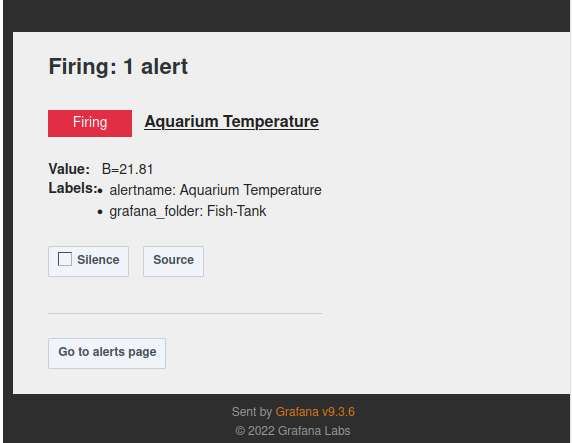
If there's an interruption in data being received (for example because someone accidentally bought a counterfeit temperature probe which has dropped off the bus...) an alert mail goes out to notify of the deadman
Of course, it's not just temperature that we want to alert on: because we collect filter flow rate we can alert if it drops below a threshold (indicating either pump issues or a clog in the filter or its intake)
I also have a seperate alert with an upper threshold - if the tank suddenly starts pumping very quickly it might indicate that we're pumping water all over the floor somewhere beyond the meter.
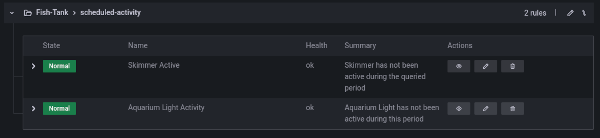
There are also alerts based on power consumption to check that scheduled tasks (like the daily surface skimmer run) actually happened. These are driven by (more or less) the same query used for the status cells in the dashboards
Once I have the bits for it, I'll create a PH level based alert too.
Conclusion
It's fairly straightforward to automate collection of metrics from an aquarium.
Most of the components involved are also relatively inexpensive with the most expensive sensor being the water-flow meter (at £10). Obviously, the project's cost would have been higher if I hadn't already had a raspberry pi lying around, although it should be possible to do all of this with a cheap Raspberry Pi Zero or an Arduino Nano.
As with anything involving water and piping, there is a little risk involved in fitting a water-flow meter: any join carries some risk of leakage. If you really didn't mind the look, that could be mitigated by fitting the meter inside the tank (obviously above the waterline) so that any leak remained inside the tank.
Now that I've got the base system setup, it's not just the forthcoming PH sensor that can be fitted, there are various other probes on the market which could help monitor water quality - for example a Total Dissolved Solids (TDS) sensor could probably be used to predict the levels of ammonium nitrate present in the water column.
The real challenge, as I found with my temperature sensor, is in finding sensor hardware that's genuine, reliable and affordable.
As well as providing automated monitoring/alerting, getting this all setup also helps to kill a little bit of time whilst waiting for the tank to cycle.