Energy usage Monitoring With TP-Link Smart Sockets and InfluxDB
I've written in the past about the approach I use to monitor our electricity usage.
A key part of that monitoring is the use of Smart Sockets, these allow me to record usage of particular appliances (the aim is that, eventually, most things will be monitored via one of these sockets).
When I wrote the original post, I was using TP-Link Kasa KP115 Smart Sockets, but TP-Link have since discontinued the Kasa range and moved their focus to the Tapo family (which even have a different app.... sigh). There's an example of my use of TP-Link Tapo P110s here.
My collection of stats from these device has relied on a couple of quickly hacked together scripts (Kasa and Tapo) which poll the devices for usage information and then push that data into InfluxDB.
This weekend I decided it was time to tidy those up, so this post is about how to monitor electricity usage by collecting data from Kasa and Tapo smart-plugs and writing it into InfluxDB.
Approach
We'll periodically run a small docker image to poll the devices for usage information and write those statistics onwards into InfluxDB.
Configuration
The first thing is to create a configuration file. The utility consumes a YAML file which consists of 3 sections
-
kasa: enumerates Kasa devices -
tapo: enumerates Tapo devices and provides the credentials necessary to log into them -
influxdb: enumerates outputs to write to
InfluxDB
The image can write into any InfluxDB version which exposes the V2 write API (so 1.8.0 upwards), including InfluxDB Cloud.
If you want local buffering, you can also write into a Telegraf instance by enabling the influxdb_v2_listener plugin.
If you want to dual-write, multiple outputs can be listed within the configuration file:
influxdb:
    -
        name: "Cloud"
        url: "https://foo.example.com"
        token: "aaabbbccc=="
        org: "my org"
        bucket: "telegraf"

    -
        name: "local"
        url: "http://127.0.0.1:8086"
        token: ""
        org: ""
        bucket: "testing_db"
Or, if you're writing into a OSS >= 2.2 instance, you can use the built in Edge Data Replication functionality to have InfluxDB replicate onwards to another instance.
Kasa
Kasa devices are fairly simple, the image just needs an IP/hostname and a name. The name is how the device will be referred to within the InfluxDB dataset (for example big-fridge):
kasa:
    devices:
        -
            name: "desk-plug"
            ip: 192.168.3.150

        -
            name: "tumble-dryer"
            ip : 192.168.3.151
Although Kasa devices support local only communication, it's worth being aware that this has been removed/broken in the past.
Tapo
The way that authentication works for Tapo devices is slightly different - the utility first needs to make an authenticated call to Tapo's cloud in order to acquire an authentication cookie to present to the local socket.
So, the tapo section also requires that you provide the username and password for your Tapo account (you'll have created this when first setting the app up)
tapo:
    user: "me@mymail.com"
    passw: "mysecretpass"
    devices:
        -
            name: "washing-machine"
            ip : 192.168.3.152

        -
            name: "big-fridge"
            ip : 192.168.3.153
This built-in reliance on the availability of Tapo's cloud unfortunately means that Tapo devices are inferior to Kasa device for local monitoring purposes, as their resiliency is reliant on a third-party service.
Putting it together
So, taking the above snippets, our config file might look a little like this
influxdb:
    -
        name: "Cloud"
        url: "https://foo.example.com"
        token: "aaabbbccc=="
        org: "my org"
        bucket: "telegraf"

    -
        name: "local"
        url: "http://127.0.0.1:8086"
        token: ""
        org: ""
        bucket: "testing_db"

kasa:
    devices:
        -
            name: "desk-plug"
            ip: 192.168.3.150

        -
            name: "tumble-dryer"
            ip : 192.168.3.151


tapo:
    user: "me@mymail.com"
    passw: "mysecretpass"
    devices:
        -
            name: "washing-machine"
            ip : 192.168.3.152

        -
            name: "big-fridge"
            ip : 192.168.3.153
We can save this as config.yml (the filename doesn't matter, just update subsequent commands if you change it).
Running the container
The only thing that the container needs passed into it, is the configuration file, so we can invoke the utility as follows
docker run \
--rm \
--name="tplink_to_influxdb" \
--net=host \
-v $PWD/config.yml:/config.yml \
bentasker12/tplink_to_influxdb:latest
In this command we:
- tell docker to remove the container once it's completed (
--rm), this helps prevent never-to-be-used-again root volumes from filling the host up. - override the name of the container (
--name="tplink_to_influxdb") so that it's obvious what it is - optional: use host networking (
--net=host). This allows the utility to connect to the host's loopback (127.0.0.1) if influxDB is running on the host - export the config file from the current working directory into the container at
/config.yml(-v $PWD/config.yml:/config.yml)
The container will run and generate a little output:
Plug: desk-plug using 58.992W, today: 0.629 kWh
Plug: tumble-dryer using 0.523W, today: 0.011 kWh
Plug: washing-machine using 0.187W, today: 0.003 kWh
Plug: big-fridge using 5.029W, today: 2.102 kWh
If writes to an InfluxDB instance failed, you may also see a line like
Failed to send point to <influx name>
If, for some reason, you don't want to use docker, it is also possible to invoke the script directly.
Scheduling
Once you're happy that it works, you can schedule the run in cron
crontab -e
I use the following crontab entry (remember to update the path to your YAML config)
* * * * * docker run --rm --name="tplink_to_influxdb" -v /home/ben/docker_files/readings_collect/config.yml:/config.yml --net=host bentasker12/tplink_to_influxdb:latest
The container should then be triggered once every minute and report power usage into InfluxDB.
Querying Data
Once the data is in InfluxDB it can be queried back out with Flux.
The configured name of a socket is written into a tag named host and the usage values are written into the following fields
-
consumption: current reading (unit: W) -
watts_today: reported usage today (Wh)
A device's current consumption can be retrieved with a query like
from(bucket: "Systemstats")
  |> range(start: v.timeRangeStart, stop: v.timeRangeStop)
  |> filter(fn: (r) => r._measurement == "power_watts" and r._field == "consumption")
  |> filter(fn: (r) => r.host == "${device}")
  |> group()
  |> aggregateWindow(every: v.windowPeriod, fn: last)
  |> map(fn: (r) => ({_value: r._value}))
The smart sockets don't have the ability to report cost, however the clamp meter I use for monitoring usage at the meter does.
So, where I want to report cost, I join data about the device and the meter so that I can take the per-unit cost from the meter's information:
// Get usage info
usage = from(bucket: "Systemstats")
  |> range(start: v.timeRangeStart, stop: v.timeRangeStop)
  |> filter(fn: (r) => r._field == "consumption")
  |> filter(fn: (r) => r.host == "${device}")
  |> aggregateWindow(every: v.windowPeriod, fn: last)
  |> toFloat()

// Get costing information for the same time period
cost = from(bucket: "Systemstats")
  |> range(start: v.timeRangeStart, stop: v.timeRangeStop)
  |> filter(fn: (r) => r._measurement == "power_watts")
  |> filter(fn: (r) => r._field == "unit_cost")
  |> filter(fn: (r) => r.host == "power-meter")
  |> group()
  |> aggregateWindow(every: v.windowPeriod, fn: mean)


// Join the tables and calculate electricity cost
join(tables: {t1: cost, t2: usage}, on: ["_time"])
   |> map(fn: (r) => ({
      _value: r._value_t1 * (float(v: r._value_t2) / 1000.0),
      _time: r._time,
      device: r.host,
      _field: "consumption_cost"
   }))
   |> last()
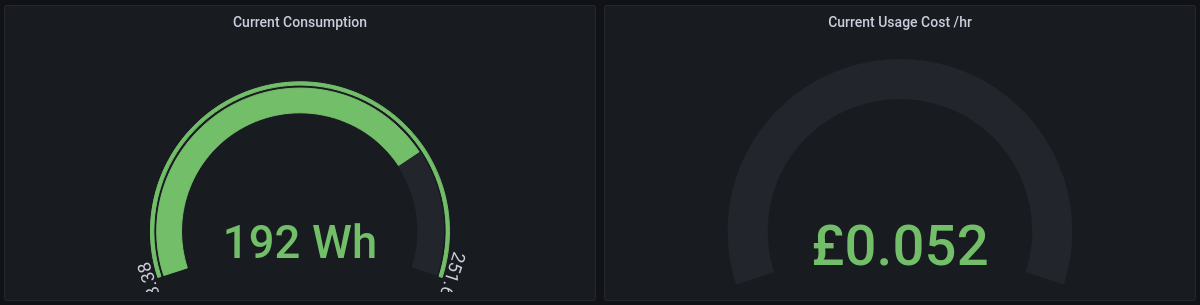
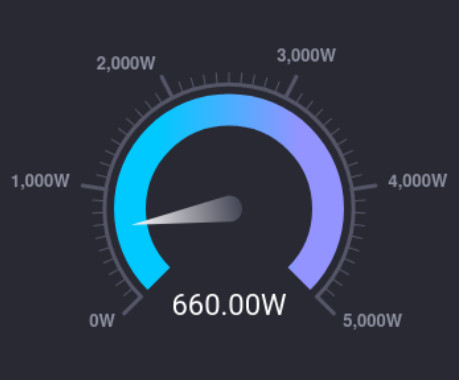
The devices are also represented in the category graphing provided by my In-House-Display

There are a couple of example dashboards in the Github repo:
They'll almost certainly need tweaking a little, but should provide a base to start from.
Conclusion
It's now quite easy to collect usage data from Kasa and Tapo smart plugs: it's just a case of spinning up a docker container and having it write the data into InfluxDB.
There are still some improvements to be made to the utility, but the base functionality is there.