Tracking My Website Performance and Delivery Stats in InfluxDB
Earlier this year, I moved from serving www.bentasker.co.uk via my own bespoke Content Delivery Network (CDN) to serving it via BunnyCDN.
It was, and remains, the right decision. However, it did mean that I lost (convenient) access to a number of the stats that I use to ensure that things are working correctly - in particular service time, hit rate and request outcomes.
I recently found the time to look at addressing that, so this post details the process I've followed to regain access to this information, without increasing my own access to PII (so, without affecting my GDPR posture), by pulling information from multiple sources into InfluxDB.
Delivery Stats
I do not have BunnyCDN configured to send me full logs - their portal instead shows an extremely limited overview consisting of
- Status
- Timestamp
- Remote subnet (anonymised down to
/24) - Response size
- Request Path
- User-agent
- Referrer URL
It is possible to have Bunny write fuller logs into a pre-defined storage location (or send them via syslog). Whilst that would make things easier by exposing more data to me, it would err.... expose more data to me.
I try to work on a principle of least-required-access, and storing request specifics just so that I can derive aggregate stats doesn't feel great. Of course, on top of that, I'd also need to run and maintain infra capable of processing those logs.
So, I decided instead to rely on the aggregate statistics that Bunny expose via their API.
Response Time Statistics
Response time is a useful indicator, however BunnyCDN's stats do not include edge response times.
Whilst this might seem like a shortcoming, it's generally best not to trust your CDN provider to provide that statistic anyway. This isn't a suggestion that providers might be dishonest, but that in practice, there's a lot of nuance to service times reported from the serving end:
- Is the reported time just the time to pass data to the kernel (so end-user experienced time might be much longer on congested networks)?
- Is the reported time Time To First Byte, Time To Response Body or Total Time?
It's incredibly easy to be misled by server-side response times. For example, if your response is small enough that it can be written, in it's entirety, to the kernel's send buffer, you'll report a throughput that the physical network can't actually achieve.
Trying to track the time end-to-end also brings it's own complex set of headaches, but rather than going down that rabbit hole: server side response times can be extremely useful when troubleshooting infra, but it's not my infra and won't be me troubleshooting at that level.
What's needed, really, is a check by something operating as a client.
Javascript probes
I could have opted to add a javascript probe to page responses to report back load time with something like
var responseTime = window.performance.timing.domContentLoadedEventEnd - window.performance.timing.navigationStart;
But, that's more coverage than I currently want/need. It's possible I may re-introduce some basic analytics to the site at some point, but I've whittled the amount of javascript on the site right down, and don't really relish the thought of increasing it. Nor do I particularly like the idea of implementing probes that can track user movements across my sites, when all I currently need is aggregate data.
Availability Checker
I monitor uptime with UptimeRobot, so it made more sense to consume their API and pull out observed status and response time.
Arguably it's not as representative a test, but that's actually a good thing: when comparing two UptimeRobot requests I don't need to account for variability between two different user's home broadband connections. If I was fulfilling the role of CDN provider, I'd need the broader stats to feed into an overall delivery strategy, but as a user, there's very little I can do with those stats (other than complain to my provider).
As a site operator, what I want to know is: how does the CDN's response time fluctuate, and does it sometimes fail to serve my probes?
The probes generated by UptimeRobot are more than sufficient to answer that, and don't require or enable tracking user movement/behaviour across my sites.
Collecting the data
I now knew where I was going to collect data from, so the next step was to actually collect it.
Having Telegraf handle this was something of a no-brainer, so I created a couple of exec plugins:
The respective README's give details on how to configure them, so I won't go into too much depth here, but essentially having deployed the scripts, I just added the following to Telegraf's config
[[inputs.exec]]
  commands = [
    "/usr/local/src/telegraf_plugins/bunny-cdn-stats.py [API_KEY]",
  ]
  timeout = "60s"
  interval = "15m"
  name_suffix = ""
  data_format = "influx"

[[inputs.exec]]
  commands = [
    "/usr/local/src/telegraf_plugins/uptime-robot.py",
  ]
  timeout = "60s"
  interval = "5m"
  name_suffix = ""
  data_format = "influx"
One daemon reload later, and the stats started coming in.
Data collected
I was now writing the following into InfluxDB
- BunnyCDN: Request Hit Ratio (
RHR) - BunnyCDN: Bytes served at the edge (
edge_bytes) - BunnyCDN: Average origin response time (
mean_origin_response_time) - BunnyCDN: Average Request Hit Ratio (
mean_rhr) - BunnyCDN: Bytes served by origin (
origin_bytes) - BunnyCDN: Origin Response time (
origin_response_time) - BunnyCDN: Number of requests served (
requests_served) - BunnyCDN: Requests with 3xx status (
status_3xx) - BunnyCDN: Requests with 4xx status (
status_4xx) - BunnyCDN: Requests with 5xx status (
status_5xx) - BunnyCDN: Total bandwidth used (
total_bandwidth_used) - BunnyCDN: Total origin traffic (
total_origin_traffic) - BunnyCDN: Total Requests served (
total_requests_served) - UptimeRobot: Average Response Time (
avg_response) - UptimeRobot: Response Time (
response_time) - UptimeRobot: Monitored status (
status)
Although it might seem like there's some duplication between fields (for example mean_origin_response_time vs origin_response_time), this is because the API's return point-in-time as well as historic stats:
{
  "AverageOriginResponseTime": 275,
  "OriginResponseTimeChart": {
    "2021-11-06T00:00:00Z": 0,
    "2021-11-06T01:00:00Z": 0,
    "2021-11-06T02:00:00Z": 0,
    "2021-11-06T03:00:00Z": 0,
    }
}
In the example above, AverageOriginResponseTime is the average time for the entire period queried, whilst the values within OriginResponseTimeChart are averages for each specific hour.
They're both useful, so the plugin captures both.
As a rolling average, AverageOriginResponseTime helps show how the mean shifts between polls, whilst OriginResponseTimeChart gives a more strictly bound indication of when something happened.
Byte Hit Ratio
The stats above include Request Hit Ratio (RHR), but not Byte Hit Ratio (BHR). This is because BunnyCDN do not directly expose that statistic.
For the uninitiated, there are two different types of Hit Ratios, both of which are important.
To help understand them, if we take the following set of 5 example requests
Method  Path       Bytes   Disposition
GET     /foo.jpg   100     HIT
GET     /bar.jpg   100     HIT
GET     /sed.mp4   1000    MISS
GET     /page.html 100     MISS
GET     /foo.jpg   100     HIT
We can calculate the following Hit Ratios for this sample
- Request Hit Ratio: There were 3 HITs out of 5 requests:
(3/5)*100= a 60% RHR - Byte Hit Ratio: 300 bytes of 1400 were served from cache:
(300/1400)*100= a 21% BHR
The difference between them is pretty significant and either can be extremely misleading when taken in isolation.
For example, consider that
- when you load a page on www.bentasker.co.uk, javascript places a request for
/index.jsonin order to populate the "Latest Items" module. -
/index.jsononly changes when I post a new article -
/index.jsonis therefore very cacheable -
/index.jsonis around 1.5KB
So, for every page request, there's a second request made, with an extremely high chance of a cache-hit.
It doesn't amount to many bytes (so doesn't make much different to BHR), but is still a request (as is any other asset, bigger or smaller), so the resulting increase in RHR is disproportionate to the increase in BHR.
Even if I screwed up caching rules and never succesfully cached a single HTML page, I'd likely still see a RHR of around 50%, whilst BHR would much, much be closer to 0.
Conversely, it's possible to skew BHR in the same way - I might see fantastic BHR until someone decides to watch a 200GB video that isn't in cache. The resulting BHR would look like something was badly wrong, whilst RHR wouldn't show too much of a dip.
So, it's important to check both when troubleshooting a drop-off in hit-rate graphs.
Getting back on topic... although Bunny don't include BHR, they do include all the components we need to calculate it.
Whilst I could have adjusted my plugin to calculate BHR, it's so simple to work out that I thought it made as much sense to store slightly less data and use Flux to calculate it on demand.
The following Flux gives a graph showing BHR over time for a given website (set in a Chrongraf variable called edge_zone)
from(bucket: "websites/autogen")
  |> range(start: v.timeRangeStart)
  |> filter(fn: (r) => r._field == "edge_bytes" or r._field == "origin_bytes")
  |> filter(fn: (r) => r.edge_zone == v.edge_zone)
  // The Bunny API only gives hourly stats, so use a fixed window
  |> aggregateWindow(every: 1h, fn: mean)
  // Pivot so we get one row containing both
  |> pivot(rowKey:["_time"], columnKey: ["_field"], valueColumn: "_value")
  // Perform the calculation
  |> map(fn: (r) => ({ _time: r._time,
                 // avoid div by 0 if there was no edge activity
                 BHR: if r.edge_bytes > 0 then
                       100.00-((float(v:r.origin_bytes)/float(v:r.edge_bytes))*100.00)
                 else
                    -1.00
  }))
Giving

Negative BHR
The eagle-eyed may have noticed that there are values of less than 0 in the graph above. In fact, we can even produce a more extreme example:

This is a product of the way in which Nginx based CDNs tend to work.
By default, during a CACHE_MISS, Nginx will read the entire file from origin before beginning it's response to the client. Obviously this is a bit of an issue if the response is large/slow (the slice module exists to help mitigate this).
So, you can hit a scenario where:
- The client connects to the CDN and requests
bigfile.random - The CDN doesn't have it in cache, so requests it from origin
- The origin starts delivering (say) 100MB to the CDN
- The client gets fed up of waiting and disconnects when the origin is half-way through
At this point, the CDN has fetched 50MB but delivered 0 bytes - our BHR is now negative.
It's not always the result of slowness between CDN and origin either - it might be that our origin got that 100MB to the CDN in 1 second, but then the user saw their part of the download was going to take 10 minutes (mobile data, whatever) and so cancelled. Again, we've delivered 100MB from origin, but n<100 to the client, yielding a negative BHR.
Seeing when BHR goes negative can be extremely useful, because it can help you pinpoint requests in your origin logs to see if there are files you could be caching better (or perhaps justify enabling slice).
This is why I've not prevented BHR from going negative in the Flux I used - it's a useful indicator and can help looking for improvements that can be made.
Response Times
Response times are, by comparison, much simpler to report on.
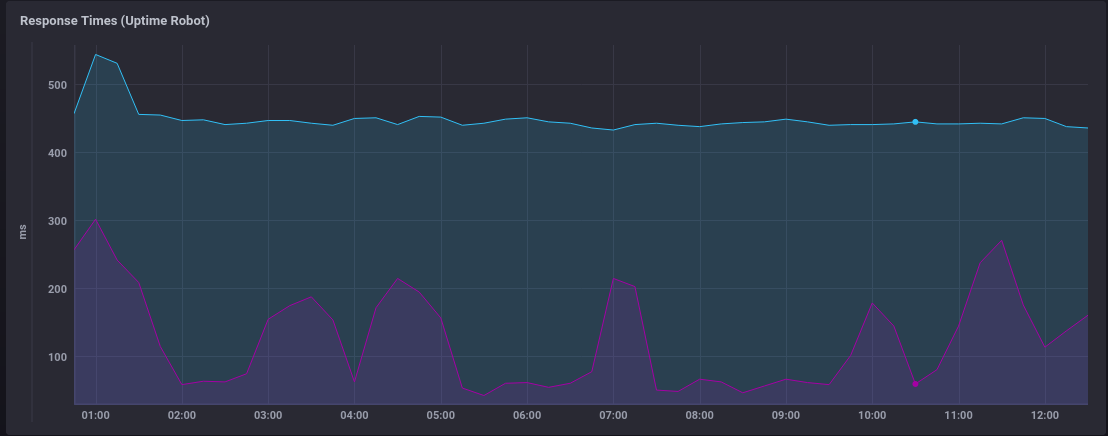
The following Flux query will report response times, over time, per monitored URL
from(bucket: "websites/autogen")
  |> range(start: v.timeRangeStart)
  |> filter(fn: (r) => r._measurement == "website_response_times" and r._field == "response_time")
  |> keep(columns: ["_time","_value","url"])
I currently only monitor two (BunnyCDN and my own CDN) as that's all I needed when I first set up Uptime Robot, but the resulting graph is easy to read

Monitoring Status
The field status reflects UptimeRobot's view of the service, with the following values:
    0 - paused
    1 - not checked yet
    2 - up
    8 - seems down
    9 - down
We can reasonably easily graph these out, but what if we want to provide a meaningful indicator of the current status?
If we wanted to just display a table giving URL and state:
from(bucket: "websites/autogen")
  |> range(start: v.timeRangeStart)
  |> filter(fn: (r) => r._measurement == "website_response_times" and r._field == "status")
  |> last()
  |> map(fn: (r) => ({ _time: r._time,
     url: r.url,
     status: if (r._value == 0) then "paused" else
                 if (r._value == 2) then "up" else
                                        "down"
                      }))
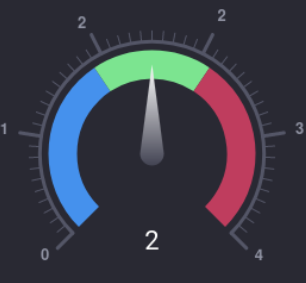
But... we can also quite easily generate a gauge:
-
0-2is neutral, it's either paused or not yet started -
2is the sweet spot -
>2means down
So, with the following simple Flux query:
from(bucket: "websites/autogen")
  |> range(start: v.timeRangeStart)
  |> filter(fn: (r) => r._measurement == "website_response_times" and r._field == "status")
  |> filter(fn: (r) => r.url == "https://www.bentasker.co.uk")
  |> last()
We can make a temperature guage

Conclusion
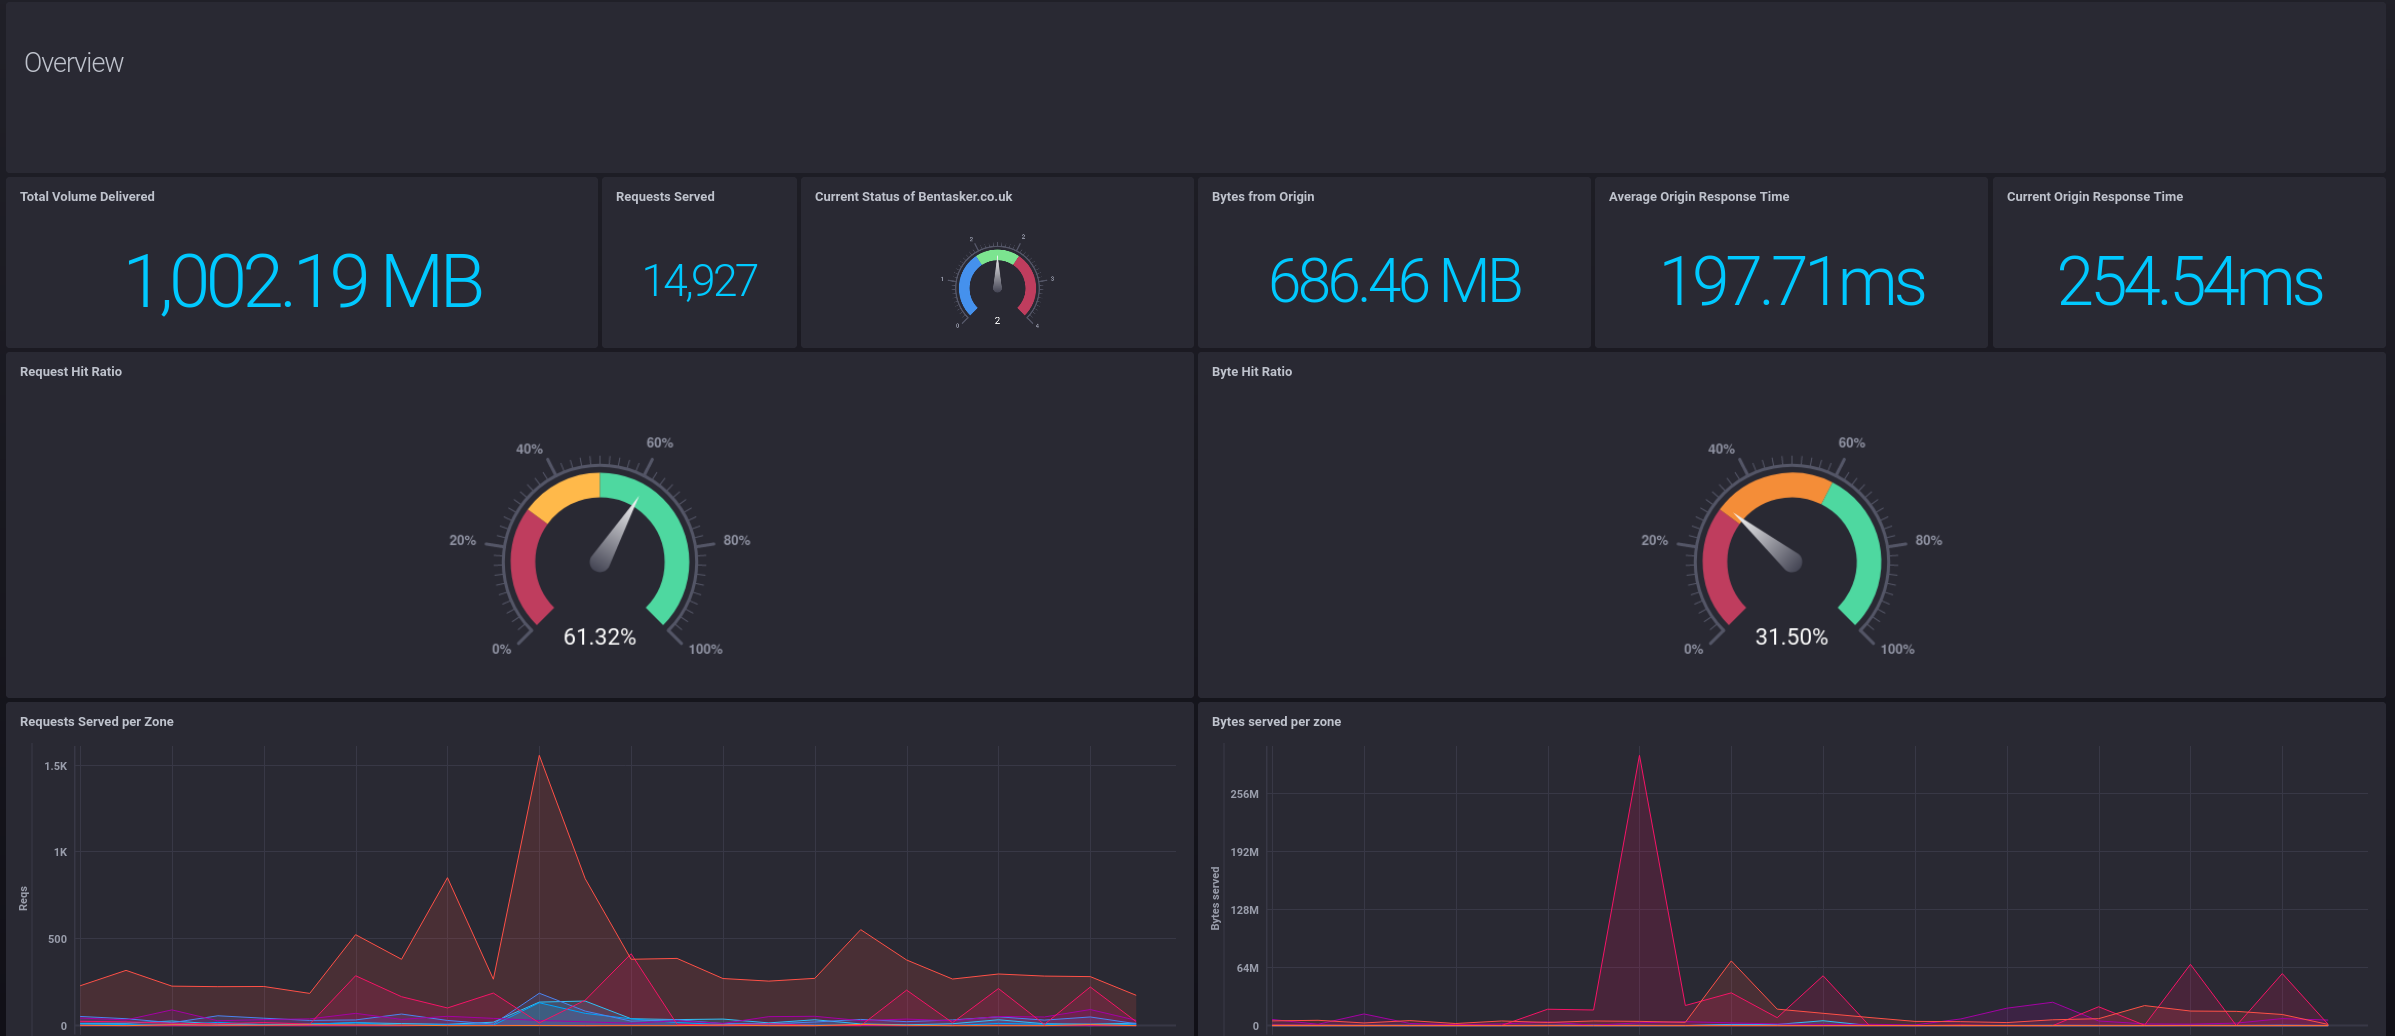
I now have a nice accessible dashboard

And have regained access to a variety of useful statistics, all without needing to make any meaningful changes to my infrastructure or making more access log information available to myself.
It's possible that, at some point in the future, I might decide I want to use JS probes to collect response times from actual visits, but the information I now have is currently more than sufficient for me to keep an eye on site performance and behaviour.
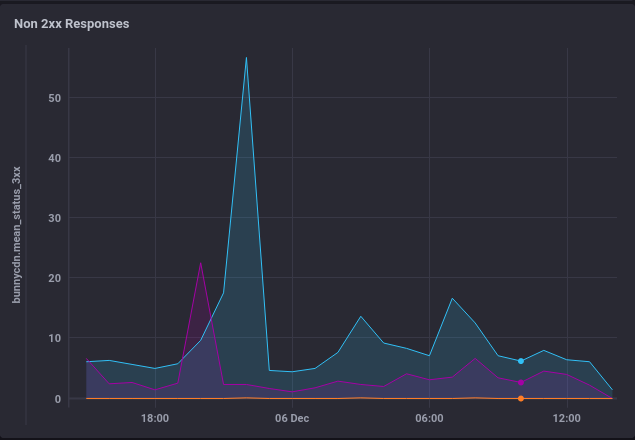
As well as seeing bandwidth and request rates, I can see a per-site breakdown of non 2xx response codes:

And can quickly pinpoint the source of slowness by comparing the Origin response time graphs to the edge response times reported by UptimeRobot (as well as looking at hit-ratio etc).
The next challenge, which I'll likely write about later, is getting my own CDN infrastructure (what's left of it) to report similar stats in so that I can monitor the lot from a single dashboard.
