Pi-Hole provides simple tooling for managing lists of ad domains to block, but sometimes simple blocklists don't provide enough coverage on their own.
Blocking Xiaomi's Tracking
The mobile phone manufacturer Xiaomi is a good example of why a more flexible blocking approach is sometimes called for.
Various views within the MIUI system UI contain tracking/ads with a broad range of regionalised addresses used to support these data harvesting activites.
For example, Xiaomi phones sometimes contact the domain tracking.intl.miui.com, but there are also regionalised variations such as tracking.rus.miui.com and tracking.india.miui.com.
Once known, these domains are easy to block, but a purely reactive approach means that there will always be periods where data is collected unimpeded.
It's far preferable, then, to be able to predict what their other tracking domains might be. Unfortunately the regionalisation of Xiaomi's services isn't particularly consistent:
- There are services at
fr.app.chat.global.xiaomi.net
- But there are none at
tracking.fr.miui.com
- There are also no services at
tracking.gb.miui.com but DNS lookups for it behave differently to those for tracking.fr.miui.com
This inconsistency makes effective blocking of Xiaomi's tracking domains via blocklists quite difficult: not only do we need to be able to enumerate all current domains, we're also reliant on Xiaomi not launching stalkerware services in a new region.
Enter Regex
Regular expressions (regex) provide a tool by which we can improve the effectiveness of our blocks.
Rather than needing to enumerate every variation of tracking.$foo.miui.com we can instead provide a pattern to match against
^tracking\..+\.miui.com$
For those not familiar with Regex, this breaks down as follows
-
^tracking. : queried name must begin with tracking (the ^ signifies start of the input)
-
.+ : allow an unlimited number of any characters
-
\.miui.com$ : the queried name must end with .miui.com (the $ signifies end of the input)
As if this wasn't powerful enough, PiHole also supports approximate matching allowing things like stemming to be used.
For example, this allows us to trivially create a regular expression that'll accept TLD substitutions:
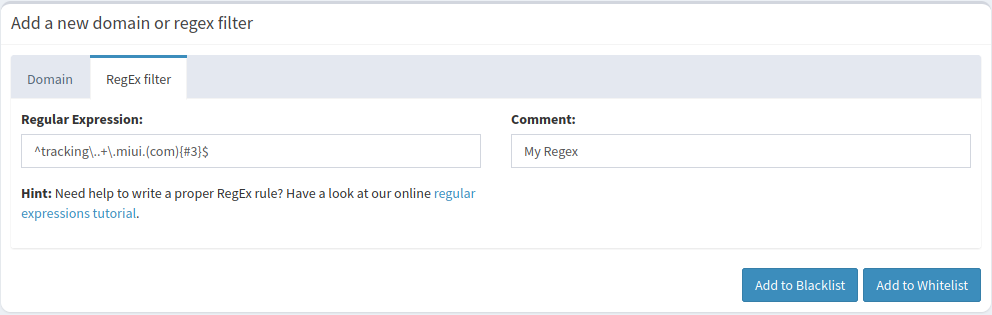
^tracking\..+\.miui.(com){#3}$
This expression will match any of the following
tracking.foo.miui.comtracking.foo.miui.orgtracking.foo.miui.net
Managing Regex in Pi-Hole
So, why do we need an entire post for this?
Adding regex blocks to Pi-Hole individually is trivial as they can be added through the web interface
However, adding a bulk list or linking a remotely maintained list provides a bit more of a challenge.
Older versions of Pi-Hole referenced a file called regex.list on disk, allowing easy automation of updates.
But support for that file was dropped when Pi-Hole Version 5 was released last year and regexes now need to be written into the gravity database.
This post details the process of automatically fetching and refreshing lists of regular expressions for Pi-Hole versions later than version 5.
Read more…