Creating a In-Home-Display (IHD) to view real-time energy usage
A month or two back, I put up a post detailing how I was capturing information on our energy usage into InfluxDB. The natural extension of that was to create an In Home Display (IHD) that displays current and historic usage.
Some time back, I created a Music Kiosk using a Raspberry Pi and a touchscreen, so it made sense to adjust that in order to fulfil both needs.
This post details the steps I took to have my kiosk run Flux queries against my InfluxDB instance to retrieve energy consumption data, and then graph it using Flot.
The Interface
The Kiosk is really just a Chrome instance in Kiosk mode - so what it displays is just a webpage.
The made things really easy, all I needed to do was create a new page to act as a menu, with an iframe for each of the music player and the graphs (a separate iframe is used so that the music can continue playing in the background).
The choice of hardware, though, does mean there's only around 784x419 pixels to play with, so the information density has to be pretty good.
Graphing
My needs were fairly simple - run a simple Flux query against InfluxDB, and format the response into something the Flot can handle.
Within the graphing page that's taken the following form (note: this original version has a [bug](link://slug/graphing-device-category-energy-usage-with-influxdb-flux-and-javascript#slug))
function sendFluxQuery(query, callback, ele_name, label, multiplier, graph_type, thresholds, prefix, dec_places){
    var request = new XMLHttpRequest();
    try{
        request.open("POST", window.influxdb + "/api/v2/query?org=myorg");
        request.setRequestHeader('Content-Type', 'application/vnd.flux');

        request.onreadystatechange = function() {//Call a function when the state changes.
            if(request.readyState == 4 && request.status == 200) {
                callback(request.responseText,
                        ele_name,
                        label,
                        multiplier,
                        graph_type,
                        thresholds,
                        prefix,
                        dec_places);
            }
        }

        request.send(query);
    } catch(e) {
        alert(e);
    }
}

function updateGraphing(text, ele_name, label, multiplier, graph_type, ignored1, ignored2){

    if (isHidden(document.getElementById(ele_name))){
        return;
    }

    lines=text.split("\n");

    data = []
    counter = 0;
    for (var i=0; i<lines.length; i++){
        l = lines[i];
        cols = l.split(",");

        if (l.slice(0,1) == "#"){
            continue;
        }

        if (counter == 0){
            /* First CSV line gives us indices */
            val_idx = cols.indexOf("_value");
            time_idx = cols.indexOf("_time");
            counter++;
            continue;
        }

        time = new Date(cols[time_idx]);
        val = cols[val_idx]*multiplier;
        data.push([time, val]);
    }

    dataset = [
        { label: label, data: data }
    ];

    if (graph_type == "line"){
        opts = window.lineoptions
    }else{
        opts = window.baropts
    }

    $.plot($("#" + ele_name), dataset, opts);
}
Which means we can generate a line graph by running
q = `from(bucket: "Systemstats")
|> range(start: -12h)
|> filter(fn: (r) => r._measurement == "power_watts" and r._field == "consumption")
|> filter(fn: (r) => r.host == "power-meter")`;

sendFluxQuery(q, updateGraphing, "recent-usage", "Consumption (W)", 1, "line", [], "", 0);
With an additional function to update simple text divs
function updateTextSection(text, ele_name, label, multiplier, graph_type, thresholds, prefix, dec_places){

        lines=text.split("\n");
        data = [];
        counter = 0;
        for (var i=0; i<lines.length; i++){
            l = lines[i];
            if (l.slice(0,1) == "#"){
                continue;
            }
            cols = l.split(",");

            if (counter == 0){
                /* First CSV line gives us indices */
                val_idx = cols.indexOf("_value");
                //time_idx = cols.indexOf("_time");
                counter++;
                continue;
            }

            if (cols.length < 6){
                continue;
            }
            //console.log(cols);
            //time = new Date(cols[5]);
            val = cols[val_idx];

            used = round(val * multiplier).toFixed(dec_places)
            ele = document.getElementById(ele_name);
            ele.innerHTML = used;

            if (prefix != ""){
                document.getElementById(ele_name+"_pref").innerHTML = prefix;
            }

            if (used > thresholds[0]){
                ele.className = "apocalyptic";
            }else if (used > thresholds[1]){
                ele.className = "high";
            }else if (used > thresholds[2]){
                ele.className = "moderate";
            }else{
                ele.className = "normal";
            }
        }
}
Which is called as follows
    q = `from(bucket: "Systemstats")
    |> range(start: -1h)
    |> filter(fn: (r) => r._measurement == "power_watts" and r._field == "consumption")
    |> filter(fn: (r) => r.host == "power-meter")
    |> last()`;

    sendFluxQuery(q, updateTextSection, "curr", "", 1, "", [2000, 1200, 700], "", 0);
The result is that we can quite trivially generate a set of graphs and stats using Flux
function refreshGraphs(){

    var d = new Date();
    d.setHours(0,0,0,0);
    midnight = d.toISOString();

    q = `from(bucket: "Systemstats")
    |> range(start: -12h)
    |> filter(fn: (r) => r._measurement == "power_watts" and r._field == "consumption")
    |> filter(fn: (r) => r.host == "power-meter")`;

    sendFluxQuery(q, updateGraphing, "recent-usage", "Consumption (W)", 1, "line", [], "", 0);


    q = `from(bucket: "Systemstats")
    |> range(start: -1h)
    |> filter(fn: (r) => r._measurement == "power_watts" and r._field == "consumption")
    |> filter(fn: (r) => r.host == "power-meter")
    |> last()`;

    sendFluxQuery(q, updateTextSection, "curr", "", 1, "", [2000, 1200, 700], "", 0);


    q = `from(bucket: "Systemstats")
    |> range(start: -1h)
    |> filter(fn: (r) => r._field == "consumption_cost")
    |> filter(fn: (r) => r.host == "power-meter")
    |> map(fn: (r) => ({ r with _value: float(v: r._value) / 100.00 }))
    |> last()
    `;

    sendFluxQuery(q, updateTextSection, "currphr", "", 1, "", [0.2, 0.15, 0.1], "£", 2);

    q = `from(bucket: "Systemstats")
    |> range(start: -1h)
    |> filter(fn: (r) => r._measurement == "power_watts" and r._field == "watts_today")
    |> filter(fn: (r) => r.host == "power-meter")
    |> last()
    |> map(fn: (r) => ({r with _value: float(v: r._value) / 1000.00 }))`;

    sendFluxQuery(q, updateTextSection, "currtot", "", 1, "", [20, 16, 14], "", 2);

    q = `from(bucket: "Systemstats")
    |> range(start: -1h)
    |> filter(fn: (r) => r._measurement == "power_watts" and r._field == "today_cost")
    |> filter(fn: (r) => r.host == "power-meter")
    |> last()
    |> map(fn: (r) => ({r with _value: float(v: r._value) / 100.00}))`;

    sendFluxQuery(q, updateTextSection, "currcst", "", 1, "", [3, 2.6, 2.5], "£", 2);


    q = `from(bucket: "Systemstats/rp_720d")
    |> range(start: -10d, stop: ` + midnight +   `)
    |> filter(fn: (r) => r._measurement == "power_watts" and (r._field == "watts_today"))
    |> filter(fn: (r) => r.host == "power-meter")
    |> aggregateWindow( every: 1d, fn: max )
    `
    sendFluxQuery(q, updateGraphing, "daily-usage", "Daily Consumption (kWh)", 0.001, "bar", [], "", 0);


    q = `from(bucket: "Systemstats/rp_720d")
    |> range(start: -30d, stop: ` + midnight +   `)
    |> filter(fn: (r) => r._measurement == "power_watts" and (r._field == "watts_today"))
    |> filter(fn: (r) => r.host == "power-meter")
    |> aggregateWindow( every: 1d, fn: max )
    `
    sendFluxQuery(q, updateGraphing, "d30-usage", "Daily Consumption (kWh)", 0.001, "bar", [], "", 0);


    q = `from(bucket: "Systemstats/rp_720d")
    |> range(start: -30d, stop: ` + midnight +   `)
    |> filter(fn: (r) => r._measurement == "power_watts" and (r._field == "today_cost"))
    |> filter(fn: (r) => r.host == "power-meter")
    |> map(fn: (r) => ({ r with _value: float(v: r._value) / 100.00 }))
    |> aggregateWindow( every: 1d, fn: max )
    `
    sendFluxQuery(q, updateGraphing, "d30-cost", "Daily Cost", 1, "bar", [], "", 2);


    calcHourlyAverageCost();
}
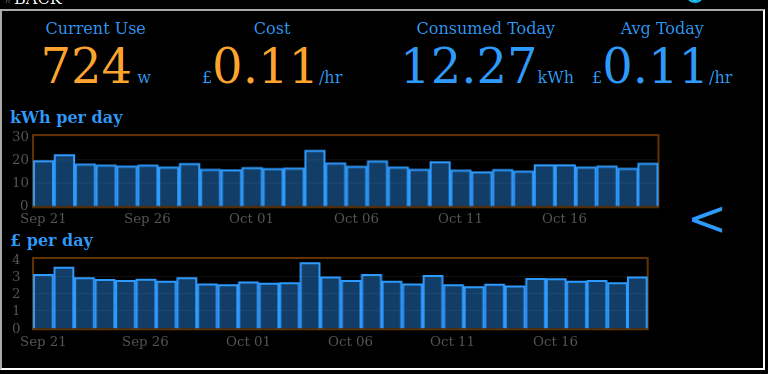
Put together with a bit of CSS, we get a nice data-rich display
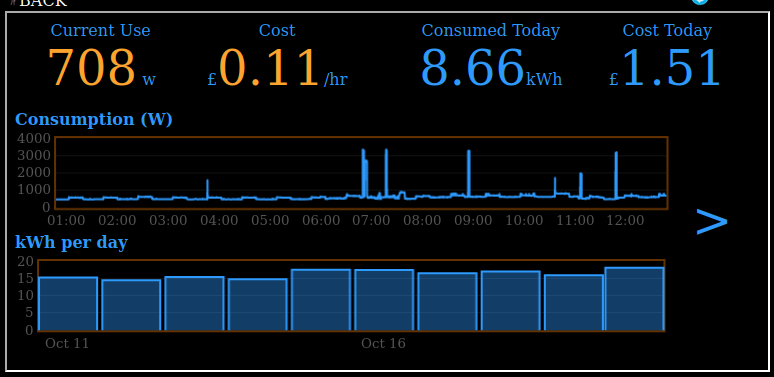
Hitting the arrow then takes us to a second page with more stats
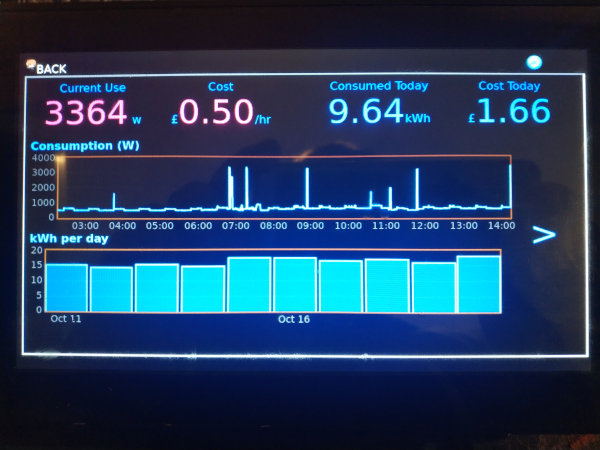
The thresholds in the functions above control the CSS class, which allows moderate/high/apocalyptically high usage to use loud colours.
Conclusion
Building the interface was pretty trivial, although as this is in the kitchen, I entertained some scope creep and also added the ability to do things like run a cooking timer or hit my recipes site.
I do suffer a bit from sausage fingers when it comes to touchscreens, but actually, the layout works quite well on the kiosk
I also added a button labelled "Serving Up" which places a call to HomeAssistant in order to pause all active media players in the house, but I'll detail implementing that another time (as it's still being refined).
At some point, I'll likely add an additional "page" to the graph frame to show per-device usage - I haven't decided yet whether that'll take the form of multiple fixed graphs, or will use a drop-down selector and a single set of graphs.
Files
The files (or a version of) created for this can be found on GitHub.