Monitoring our electricity usage with InfluxDB
The are various solutions on the market for monitoring power usage, ranging from smart meters with in-home displays (IHDs), to clamp meters linked to similar displays.
What the majority have in common, though, is a lack in granularity.
They'll commonly show you how much you've used so far today and how much you used (all day) yesterday (and maybe this week).
But, they often lack the ability to drill down further than that. This denies the user the ability to dentify why usage is high (does it jump at a certain time of day, or does it grow almost linearly through the day?).
Smart Meters
The widely touted claim that smart meters enable us to reduce consumption is itself questionable:
- the supposed benefits don't come from the meter, but from the IHD. You can have a working IHD without the need for a Smart Meter
- However you monitor your usage, there really is a limit to how much you can reduce it
But, even ignoring this, the real issue is that they don't expose the data in a way that allows you to best act upon it. Instead you're left turning stuff on and seeing how much the IHD's reading jumps.
Cloud Solutions
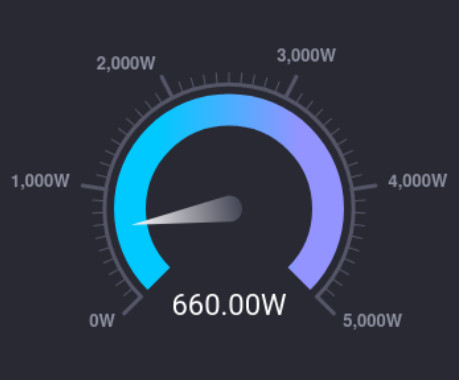
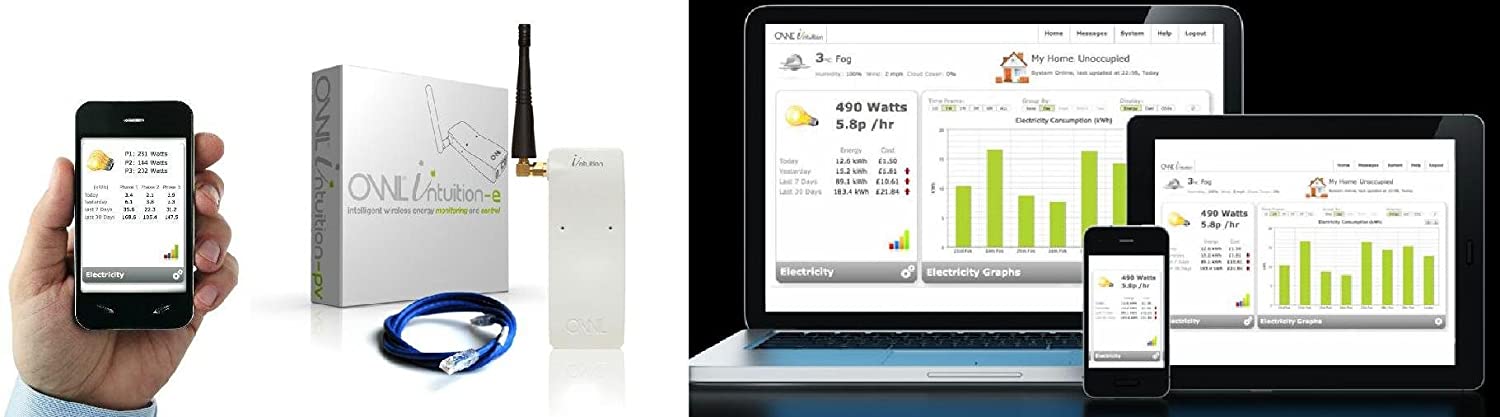
There are a variety of Cloud based solutions to choose from, but after reading around, I decided to order a cloud-linked clamp meter from the Owl Intuition-e series:
The key selling point to me was that it can be told to also send usage updates to a specific local IP - so even if the cloud service proved not to be up to scratch, I figured I could probably implement something.
Despite the (relative) triviality of making a good interrogable system, the Owl Intuition cloud interface turned out to be pretty limited - it does let you drill down over the last week, but beyond that you can only view per-day stats.
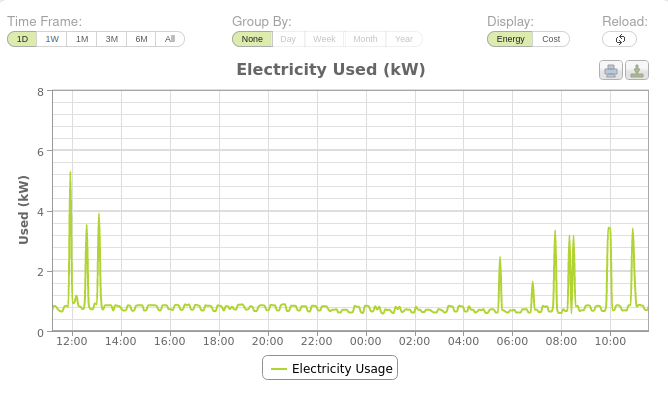
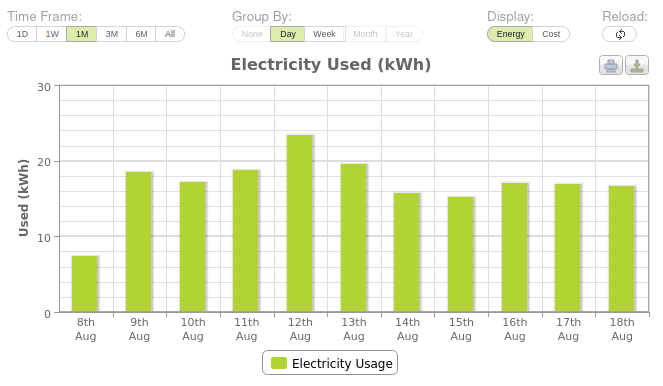
This is better than your average IHD, but still really limits your ability to investigate usage (if you get a large bill, you probably want to be able to dig into at least the last month with reasonable granularity).
There is an Android app... but it's horrifically limited, you can view current usage and that's it (so no pretty graphs). Barely worth the effort of installing really.
The service also lacks the ability to do things like monitor specific plug outlets (as far as I've been able to find, OWL don't sell any smart plugs that interact with Intuition) and/or generate alerts based on usage.
So, it very clearly was time to build my own.
The Aim
The aim was to build a system that would
- Quietly monitor our usage
- Expose graphing/tools that allowed me to view granular usage for at least the last month
- Ideally, be able to generate alerts under certain circumstances
- Be extensible - there are certain appliances/outlets that I think contribute heavily to our bills, I want to be able to graph and confirm
I've hinted at another requirement above too - my purchase of the meter clamp was heavily influenced by the fact it supported local metering.
Although you could build a solution that relied on probing the cloud-service provider's API, I will always prefer kit that can be handled locally. If nothing else, it means I don't get gaps in my graphs if the net goes down. As we'll see further down, this also heavily influenced my choice of smart-plugs when implementing plug-socket level monitoring.
InfluxDB
Collecting the data is only one part of the equation, it's got to be sent somewhere. Enter InfluxDB.
InfluxDB is a time-series database - that is a database optimised to store metrics/events that are timestamped. That's pretty much ideal for my needs, as we're almost always going to be interested in usage over time.
There are two other accompanying projects that I'm going to use (as they're designed to work with InfluxDB)
- Chronograf - graphing platform
- Kapacitor - data processing engine (useful for alerting)
Getting Usage Information
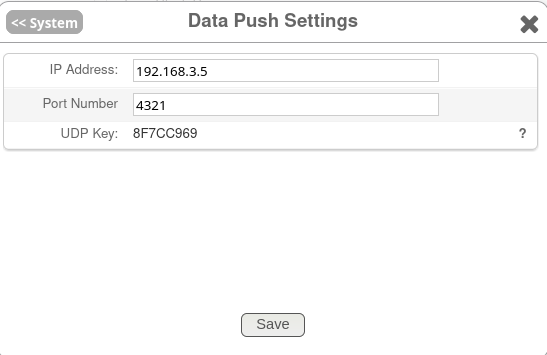
The first thing that's needed is to configure the OWL device to start sending UDP packets somewhere we can receive and process them - that has to be done through their cloud service.
Settings -> Data Push Settings
The payload of the packets are just XML:
<electricity id='443719150B2A' ver='2.0'><timestamp>1629371745</timestamp><signal rssi='-43' lqi='16'/><battery level='10%'/><channels><chan id='0'><curr units='w'>724.00</curr><day units='wh'>8516.67</day></chan><chan id='1'><curr units='w'>0.00</curr><day units='wh'>0.00</day></chan><chan id='2'><curr units='w'>0.00</curr><day units='wh'>0.00</day></chan><chan id='3'><curr units='w'>0.00</curr><day units='wh'>0.00</day></chan><chan id='4'><curr units='w'>0.00</curr><day units='wh'>0.00</day></chan><chan id='5'><curr units='w'>0.00</curr><day units='wh'>0.00</day></chan></channels><property><current><watts>724.00</watts><cost>10.87</cost></current><day><wh>8516.67</wh><cost>149.53</cost></day><tariff time='1629375345'><start>1629331200</start><curr_price>0.15</curr_price><block_limit>4294967295</block_limit><block_usage>7839</block_usage></tariff></property></electricity>shown here in Wireshark
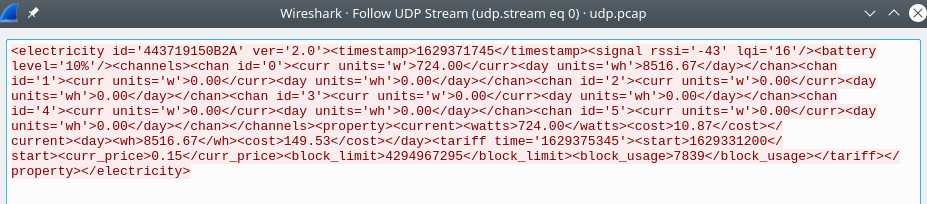
Side note for those wondering: despite the lack of XML declaration, it is valid XML. The declaration is optional in XML 1.0.
We can quite trivially capture and parse it with Python.
readable, _, _ = select.select([sock], [], [], 5)
if readable:
    data, addr = sock.recvfrom(1024)
    xml = ET.fromstring(data)
    etxml = ET.ElementTree(xml)

    r1 = (xml.find(".//curr/..[@id='0']"))
    if not r1:
        print("Failed to parse XML, skipping")
        continue
    curr1 = r1[0].text
    day1 = r1[1].text

    price = etxml.find(".//curr_price").text
    today_cost = etxml.find(".//day//cost").text
    curr_cost = etxml.find(".//current//cost").text
Having captured the data, the next thing to do is to get this data into InfluxDB.
Initially, to keep things easy, I started off with a free InfluxDB Cloud account.
Interacting with it via Python just means installing the library:
pip install influxdb-client
Then we can create a connection and write data to it
# Set up to send into Influx
client = influxdb_client.InfluxDBClient(
    url=url,
    token=token,
    org=org
)

write_api = client.write_api(write_options=SYNCHRONOUS)

p = influxdb_client.Point("power_watts").tag("host", "power-meter")
p = p.field("consumption", float(curr1))
p = p.field("watts_today", float(day1))
p = p.field("consumption_cost", float(curr_cost))
p = p.field("today_cost", float(today_cost))

write_api.write(bucket=bucket, org=org, record=p)
This creates a point, adds our fields to it, then writes it out to the DB.
Data is the visible within Influx's cloud
With the data available, it would just be a case of setting up graphing and alerting.
Local InfluxDB
However, I embarked on this as much as a learning exercise as wanting to monitor our power usage (and I like things local), so I also wanted to send data to an on-net InfluxDB instance
docker network create influxdb
docker run -d --name=influxdb --net=influxdb -p 8086:8086 -v influxdb:/var/lib/influxdb influxdb:1.8
docker run -p 8888:8888 --net=influxdb chronograf --influxdb-url=http://influxdb:8086
With that, my InfluxDB and Chronograf instances were up and running, so I just needed to extend my power-collection script to also send to the local InfluxDB instance
# Set up to send into Influx
client = influxdb_client.InfluxDBClient(
url="http://pidocker1:8086",
token=token,
org=org
)

write_api = client.write_api(write_options=SYNCHRONOUS)

p = influxdb_client.Point("power_watts").tag("host", "power-meter")
p = p.field("consumption", float(curr1))
p = p.field("watts_today", float(day1))
p = p.field("consumption_cost", float(curr_cost))
p = p.field("today_cost", float(today_cost))

write_api.write(bucket=bucket, org=org, record=p)
And data started appearing - simple.
I then went about building some dashboards/graphing, but I'll circle back around to those at the end.
Monitoring Plug Sockets
One of the things I mentioned at the outset of this, was a desire to be able to monitor usage on specific plug outlets. To achieve that, we obviously need a device plugged into those sockets, so I ordered a couple of TP-Link Kasa KP115's.
Again, a key point in my decision was that they can be controlled locally rather than having to rely on a cloud-service.
I plugged one into our tumble dryer, and another into the outlet I use on my desk (in convenient reach for testing)
There's a python library to communicate with these devices, so once they were set up on the Wi-Fi, it really was very simple to start collecting usage data from them and submit into InfluxDB (Cloud and local)
#!/usr/bin/env python3
#
# pip install python-kasa

import asyncio
import influxdb_client
from kasa import SmartPlug
from influxdb_client.client.write_api import SYNCHRONOUS

# InfluxDB config
bucket = "Systemstats" # Set your bucket
org = "" # Set your Org
token = "" # Set your token
# Store the URL of your InfluxDB instance
url=""

plugs = [
    {"name": "desk-plug", "ip": "192.168.3.150"},
    {"name": "tumble-dryer", "ip": "192.168.3.151"},
]


def sendToInflux(name, watts, today_kwh):
    ''' Take the values and send into Influx
    '''
    today_w = False
    if today_kwh:
        # Our DB uses Wh rather that kWh so need to convert
        today_w = today_kwh * 1000

    print("Sending value")

    try:
        # Set up to send into Influx
        client = influxdb_client.InfluxDBClient(
            url=url,
            token=token,
            org=org
        )

        write_api = client.write_api(write_options=SYNCHRONOUS)

        p = influxdb_client.Point("power_watts").tag("host", name)
        p = p.field("consumption", float(watts))

        if today_w:
            p = p.field("watts_today", float(today_w))

        write_api.write(bucket=bucket, org=org, record=p)

    except:
        # Even if we can't send to cloud, we still try local
        print("Error submitting to cloud")
        pass


    # Set up to send into Influx
    client = influxdb_client.InfluxDBClient(
        url="http://pidocker1:8086",
        token="",
        org=""
    )

    write_api = client.write_api(write_options=SYNCHRONOUS)

    p = influxdb_client.Point("power_watts").tag("host", name).field("consumption", float(watts))
    write_api.write(bucket=bucket, org=org, record=p)

    if today_w:
        p = influxdb_client.Point("power_watts").tag("host", name).field("watts_today", float(today_w))
        write_api.write(bucket=bucket, org=org, record=p)


# Iterate over plugs getting their state and sending to Influx
for plug in plugs:
    p = SmartPlug(plug["ip"])
    asyncio.run(p.update())

    usage_dict = p.emeter_realtime
    today_usage = p.emeter_today

    # emeter_today seems to be quite racey, sometimes returning 0 sometimes returning 0.001
    # wh usage since it was powered on (at time of writing) is 80.
    #
    # probably better to just omit the metric for now.
    #
    # It _may_ be because I've blocked the device from WAN access - https://github.com/home-assistant/core/issues/45436#issuecomment-766454897
    # sounds like it needs NTP access to be able to track this.
    #
    # Allowing UDP 123 out seems to have resolved it
    #today_usage = False

    now_usage_w = usage_dict["power_mw"] / 1000

    print("Plug: {} using {}W, today: {} kWh".format(plug["name"],
                                                    now_usage_w,
                                                    today_usage))

    sendToInflux(plug["name"], now_usage_w, today_usage)
    del(p) # Tidy away the var
(Yes, it could have been DRYer).
You can see in the comments above that I did encounter a minor issue. I blocked the plugs from accessing the outside world to prevent them from updating their firmware (TP-Link have previously disabled local control). But it seems they rely on NTP to set whatever clock is used for emeter_today and so need to be able to reach ntp.pool.org (they use whatever DNS your DHCP gives out, so just allowing UDP 123 out is sufficient to resolve).
A quick run of the script, and data appeared in InfluxDB.
Deployment
I've talked a bit about the scripts I created to collect and submit data, but they're no real use if you need to manually trigger them.
The Kasa plugs script, I configured as a cron job, to run every minute:
* * * * * /home/ben/power_readings/kasa_plugs.py
The power meter collect script, though, needs to run as a service - it's awaiting packets sent from elsewhere. So, I threw together a quick SystemD unit file for it:
[Unit]
Description=Electricity Usage Collector
After=multi-user.target

[Service]
Type=simple
Restart=always
User=ben
Environment=PYTHONUNBUFFERED=1
ExecStart=/usr/bin/python3 /home/ben/power_readings/collect.py


[Install]
WantedBy=multi-user.target
Then it was as simple as
systemctl start power-collect
systemctl enable power-collect
Dashboards
Being able to interrogate the data is fairly important (otherwise I could just use one of those dumb displays), so graphing is essential.
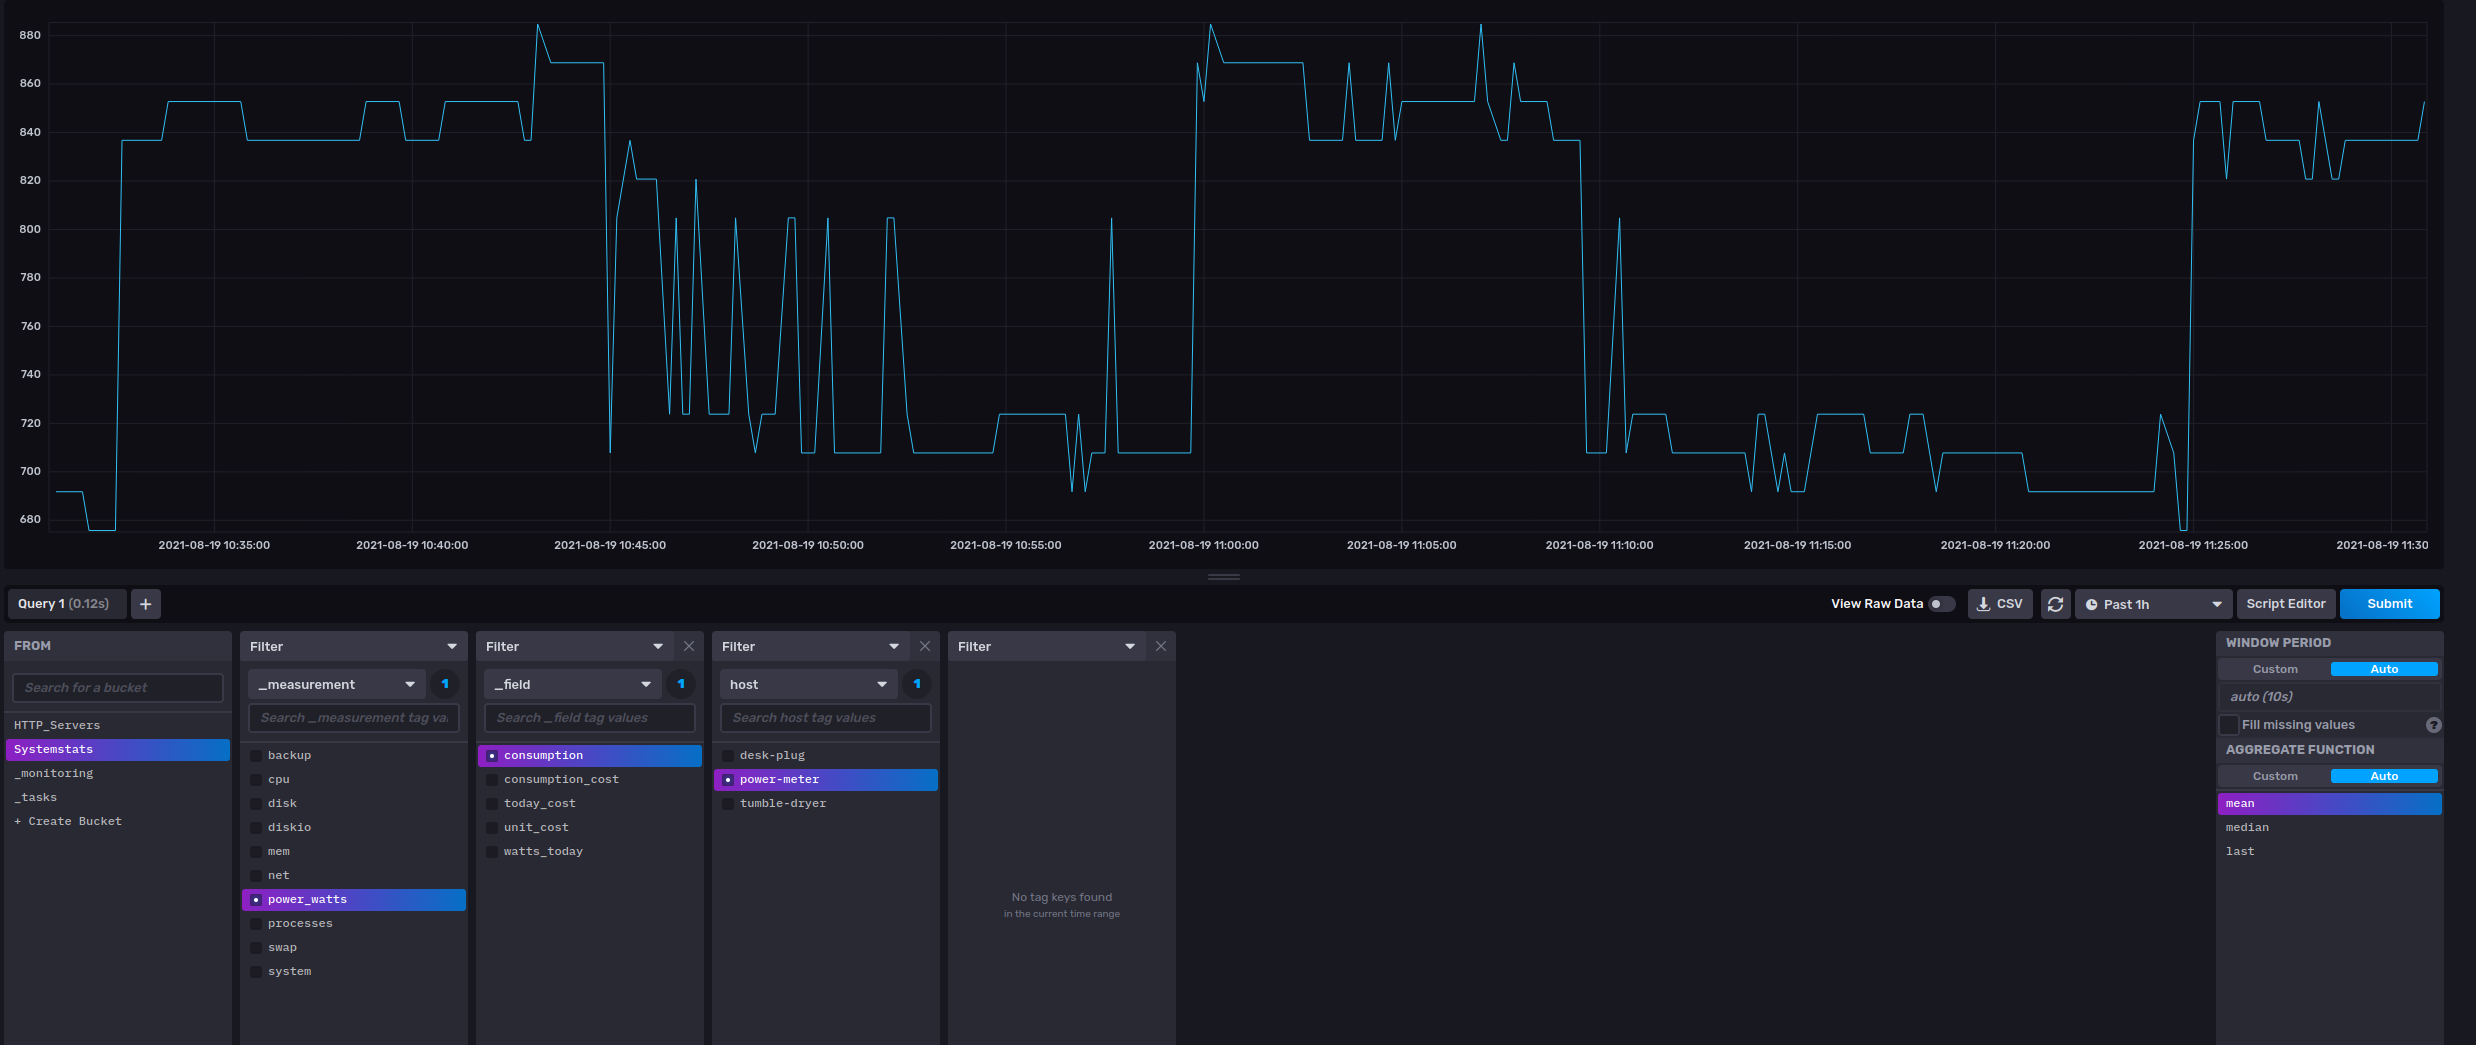
In Chronograf I created a dashboard graphing out various metrics. Creating graphs is pretty straightforward, so I won't go into too much depth, but for simple stuff you can use the wizard to create either Flux:
from(bucket: "Systemstats")
  |> range(start: dashboardTime)
  |> filter(fn: (r) => r._measurement == "power_watts" and r._field == "consumption")
  |> filter(fn: (r) => r.host == "power-meter")
or InfluxQL
SELECT mean("consumption") AS "mean_consumption" FROM "Systemstats"."autogen"."power_watts" WHERE time > :dashboardTime: AND time < :upperDashboardTime: AND "host"='power-meter'
You can also, of course, write your own.
Ultimately, the result is a dashboard full of graphs
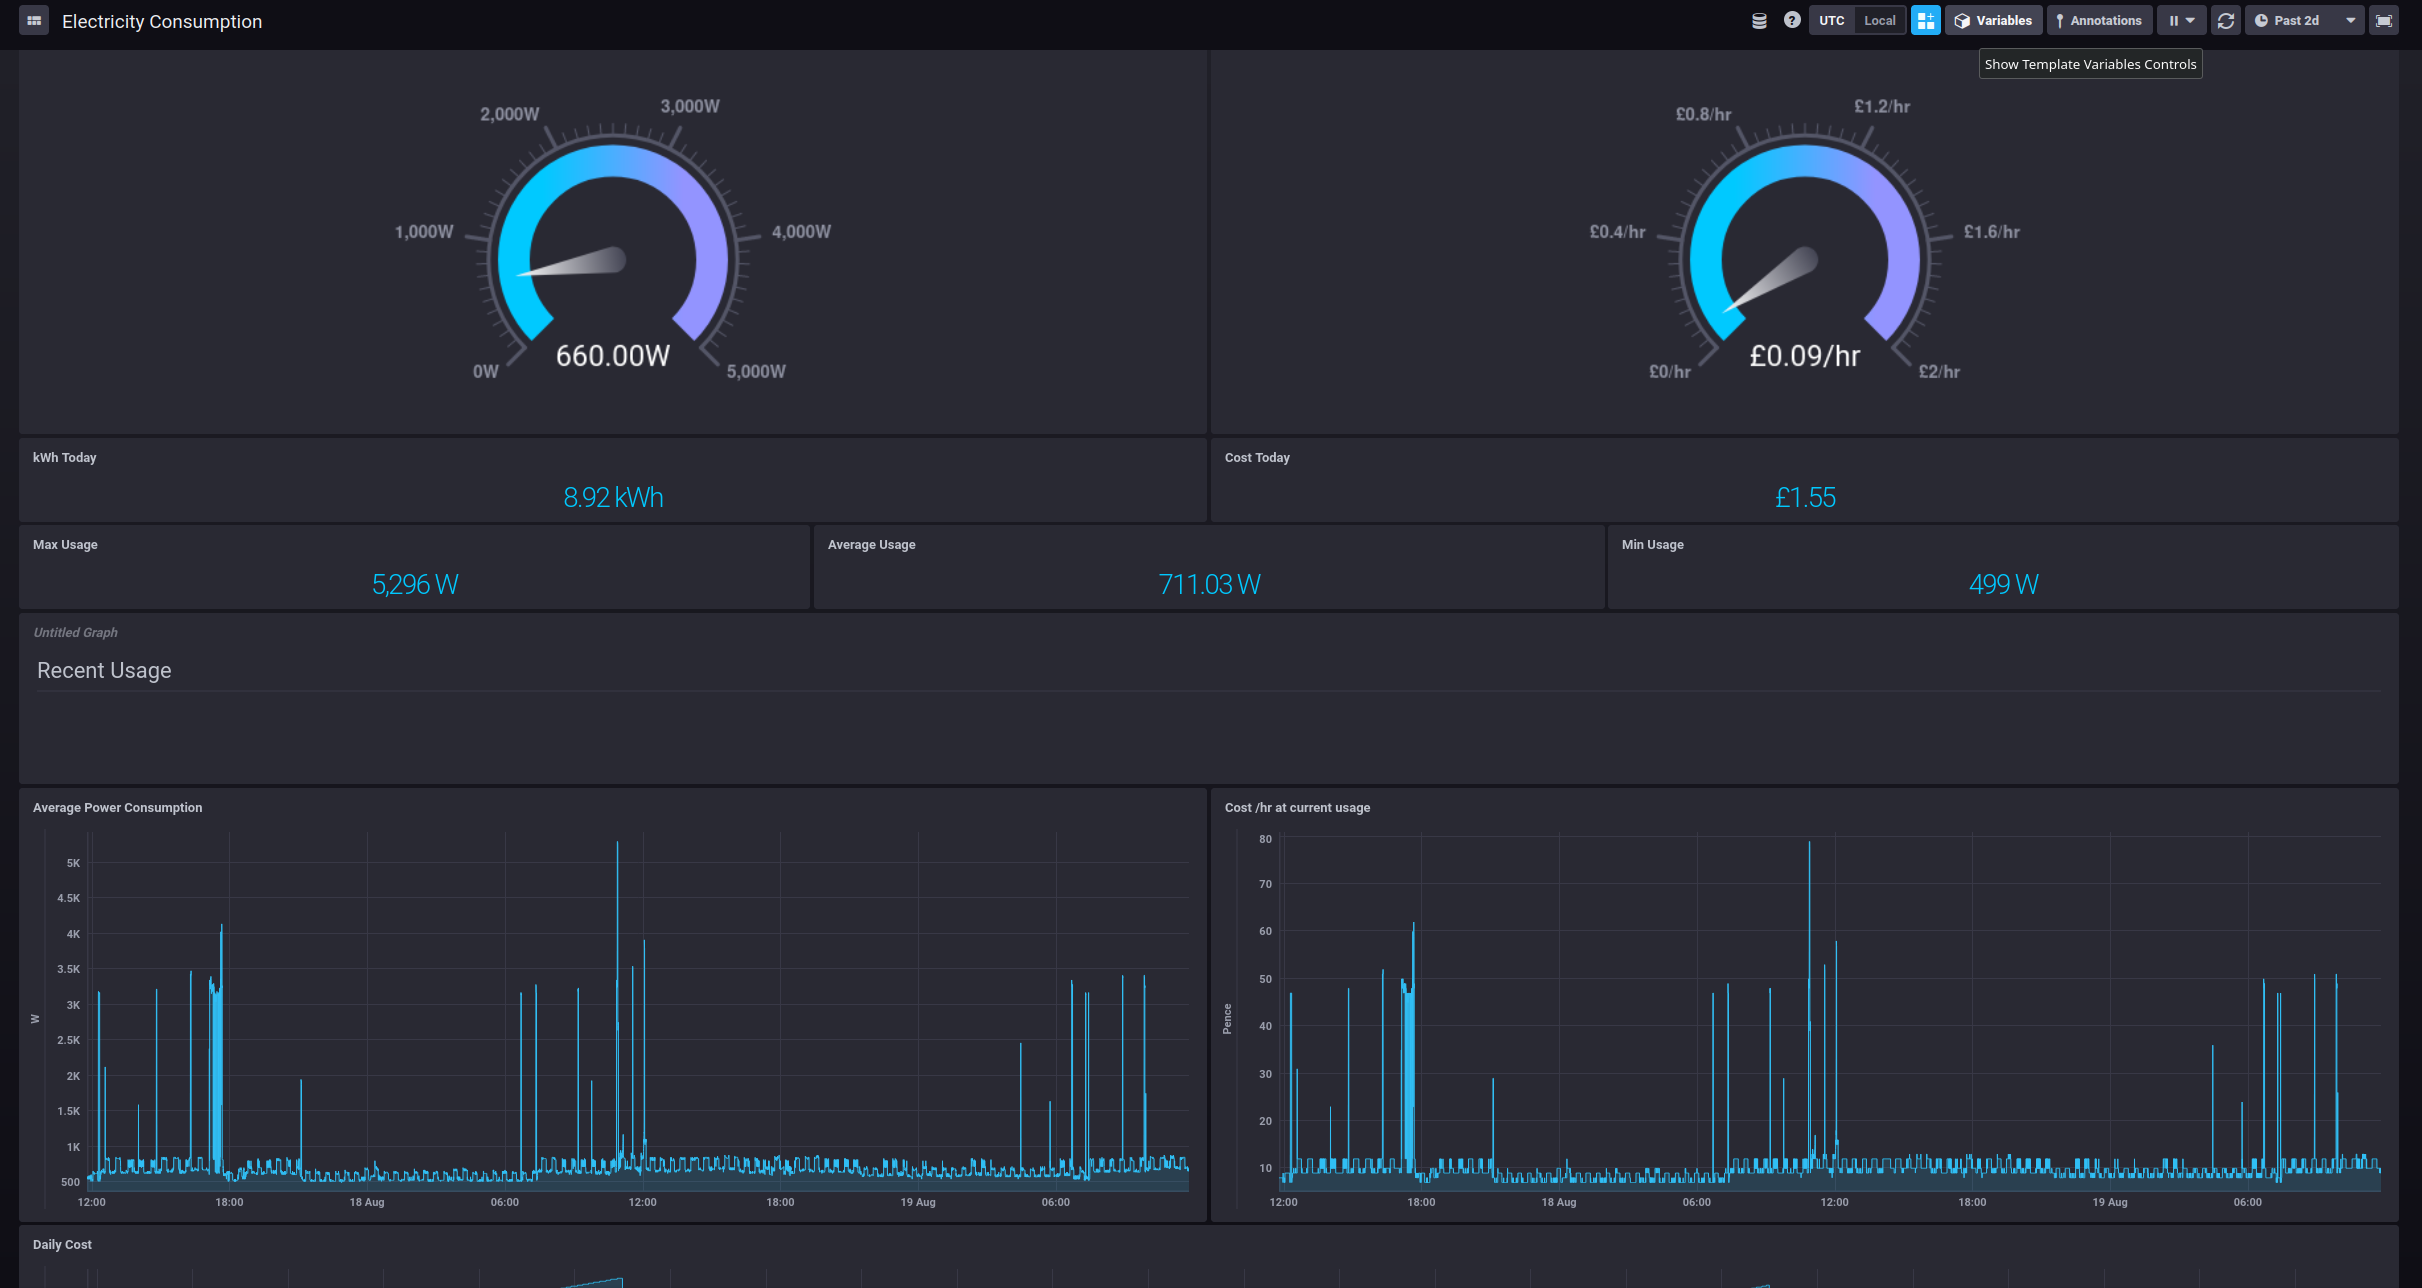
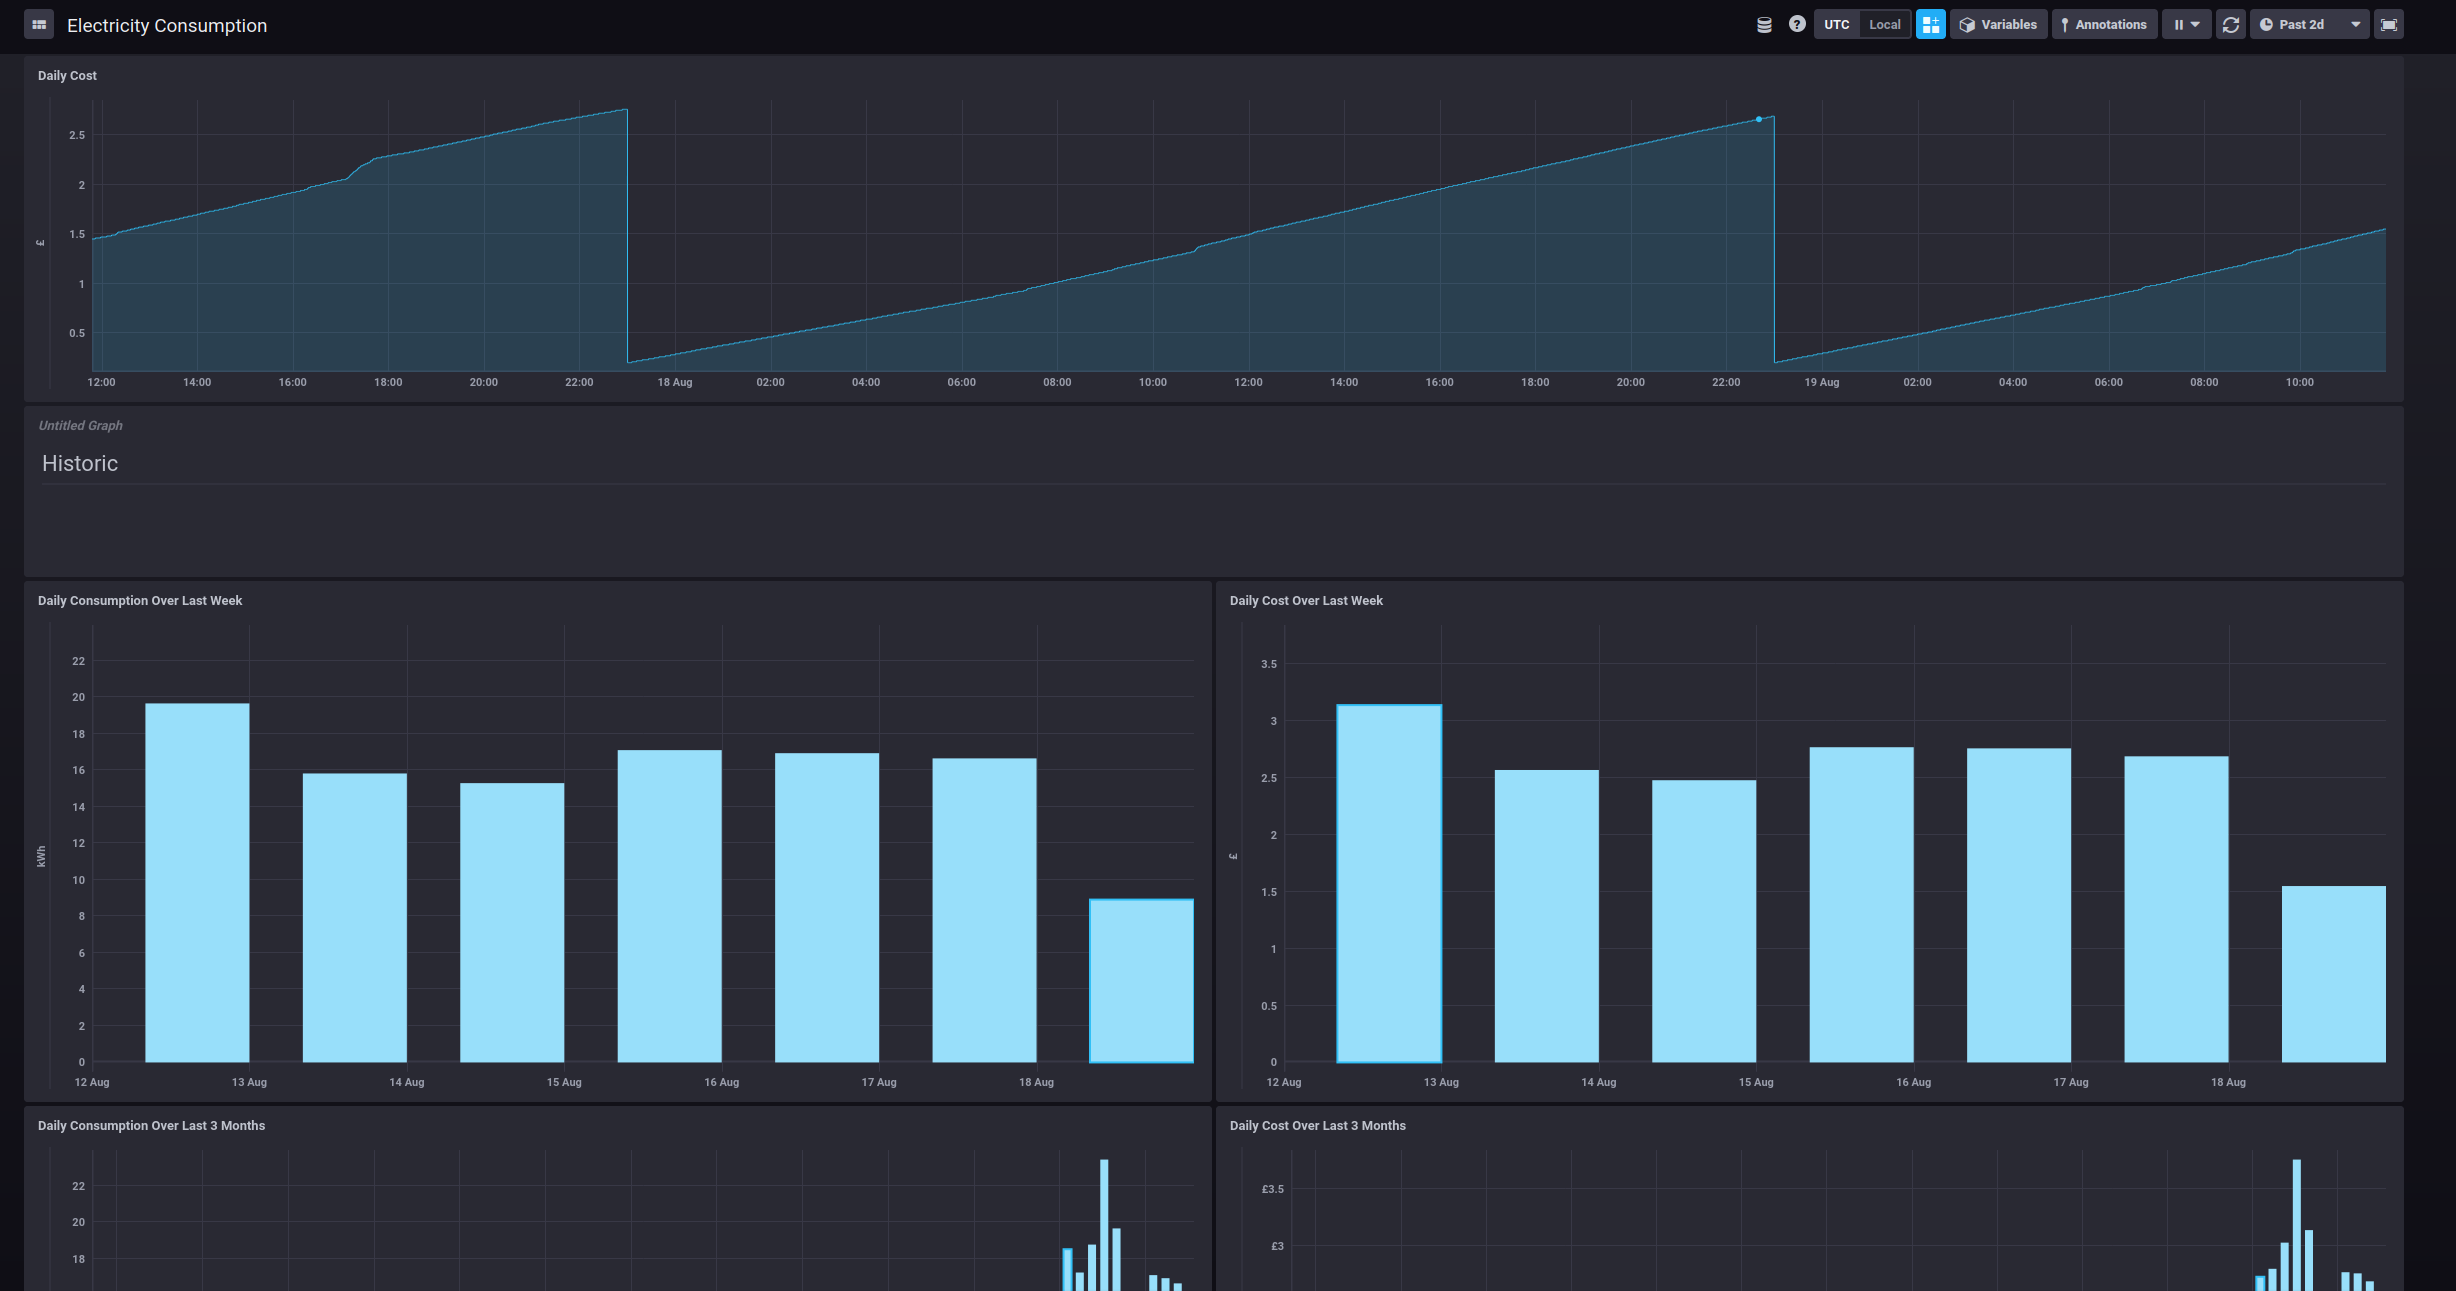
This, of course, made me quite sad as I was now able to see what we were spending on electricity.
Importantly, though, because you can drill down to interrogate the data, it starts becoming possible to see where increased usage is occurring - even just by looking at the shape of the costings graph
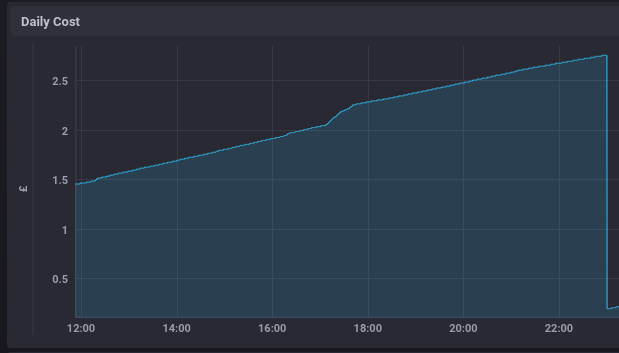
There's a jump at about 17:30 - in this case that was where I set the oven warming.
The Daily cost graph is actually quite a useful indicator in it's own right - we can see that (odd jumps aside) it grows reasonably linearly - so most of our bill relates to our (relatively) stable base load, rather than being because someone's leaving something high-consumption on for extended periods.
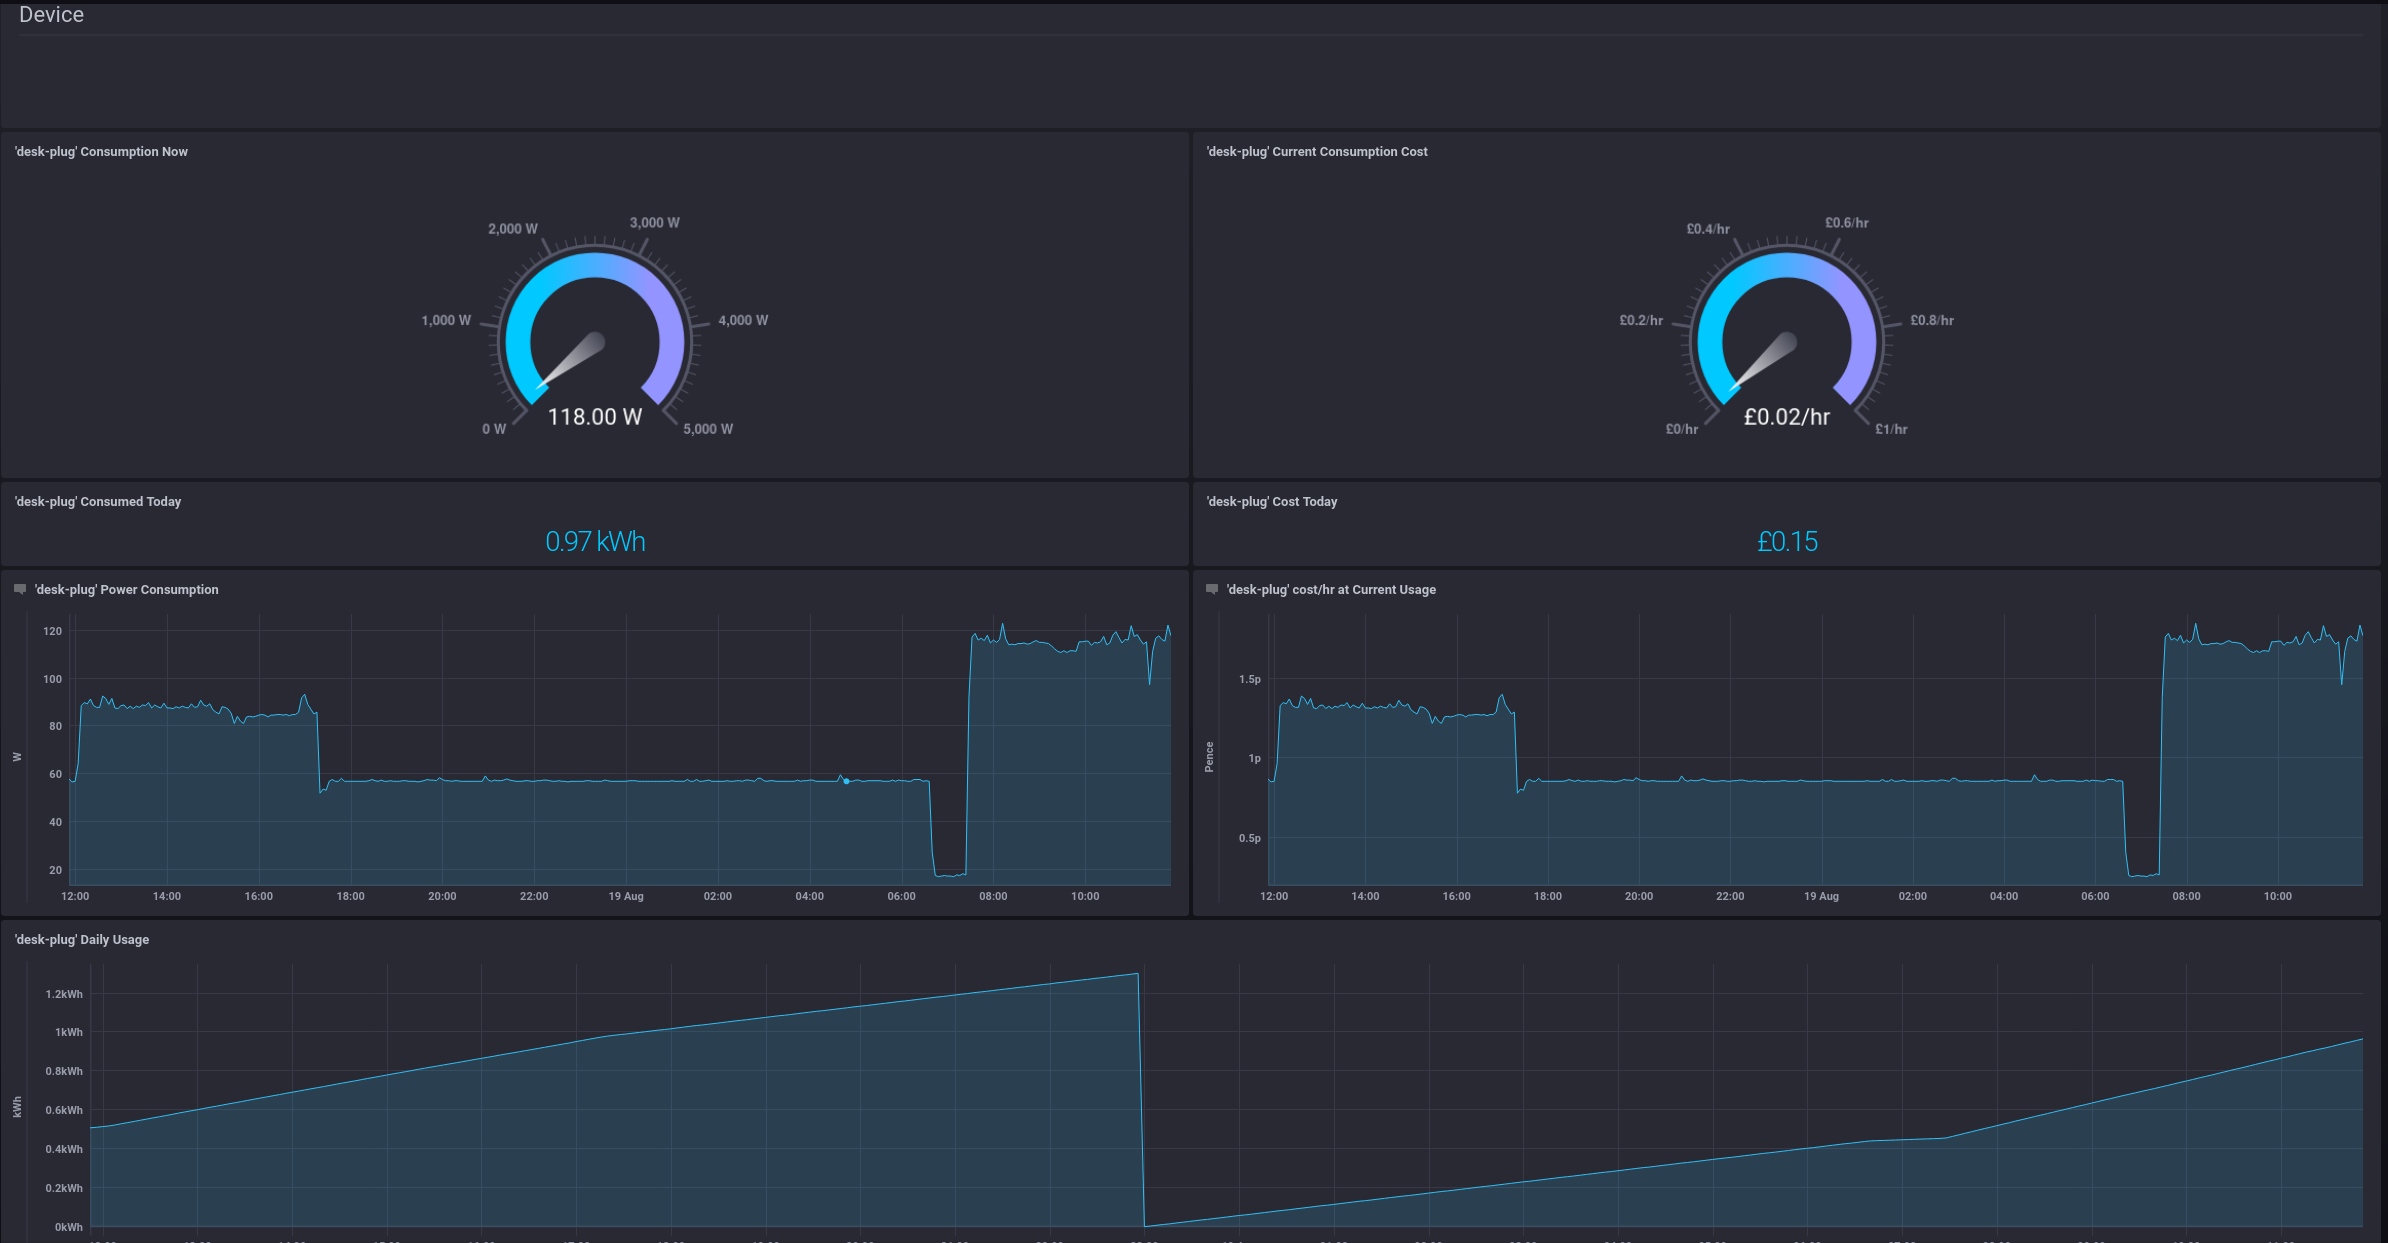
We can also view similar information for each of the Kasa plugs:
Alerting
I've not delved too far into this yet, but one of the other things I wanted was alerting based on data trends. For that, we need Kapacitor
docker run -p 9092:9092 --name=kapacitor -h kapacitor --net=influxdb -e KAPACITOR_INFUXDB_0_URLS_0=http://influxdb:8086 -v kapa:/etc/kapacitor/ -v kapadata:/var/lib/kapacitor kapacitor:1.5
Linking it into Chronograf is just a case of going to Configuration in the web panel.
An obvious starting point (at least to me) was to send an email when the Tumble dryer had finished. There's some basic SMTP config you need to do in capacitor's config file, but it's well documented elsewhere, so I'll skip that
To effect the monitoring, I created a TICK script:
var db = 'Systemstats'

var rp = 'autogen'

var measurement = 'power_watts'

var groupBy = []

var whereFilter = lambda: ("host" == 'tumble-dryer') AND isPresent("consumption")

var period = 5m

var every = 1m

var name = 'Tumble Dryer On'

var idVar = name

var message = ''

var idTag = 'alertID'

var levelTag = 'level'

var messageField = 'message'

var details = 'Tumble Dryer is {{ if eq .Level "CRITICAL" }}On{{ else }} Finished{{ end }}'

var durationField = 'duration'

var outputDB = 'chronograf'

var outputRP = 'autogen'

var outputMeasurement = 'alerts'

var triggerType = 'threshold'

var crit = 200

var data = stream
    |from()
        .database(db)
        .retentionPolicy(rp)
        .measurement(measurement)
        .groupBy(groupBy)
        .where(whereFilter)
    |window()
        .period(period)
        .every(every)
        .align()
    |mean('consumption')
        .as('value')

var trigger = data
    |alert()
        .crit(lambda: "value" > crit)
        .critReset(lambda: "value" < crit)
        .message(message)
        .id(idVar)
        .idTag(idTag)
        .levelTag(levelTag)
        .messageField(messageField)
        .durationField(durationField)
        .details(details)
        .stateChangesOnly()
        .email()
        .to([redacted])

trigger
    |eval(lambda: float("value"))
        .as('value')
        .keep()
    |influxDBOut()
        .create()
        .database(outputDB)
        .retentionPolicy(outputRP)
        .measurement(outputMeasurement)
        .tag('alertName', name)
        .tag('triggerType', triggerType)

trigger
    |httpOut('output')
This simply monitors the average consumption of the tumble dryer - it checks every minute if the 5 minute average is over 200 watts. If it is, then we can be pretty sure it's on.
The reason for the averaging is because of the tumble dryer's behaviour - it pauses periodically (I assume to let the condenser cool back down), so you get a rash of alerts if you act immediately upon a drop in power.
I've not fully finished designing this mentally, but a likely future step will be to use the HTTPPost node to talk directly to HomeAssistant and trigger automations there.
Conclusion
There's still some tweaking to be done, particularly in terms of deciding what else I want to alert on, but I've (quite easily) built a mechanism for monitoring our power usage. The real challenge really is going to be reducing that base load to get our bills down.
There is, potentially, some other pain down the road though. Unfortunately, OWL have designed their product so that access to their cloud is an ongoing requirement - when it comes time to change the batteries in the clamp meter, it'll need to be re-paired with the base station, which can only be triggered via their cloud interface. You get 2 years free access when you purchase the device, so it's a little way off, but at some point I may have to pay them just so that I can change a battery.
I haven't felt the need, yet, but it has also occurred to me that - at some point - I might want the convenience of an IHD. I should be able to quite easily achieve that by adding a tab to my Rasperry Pi based music kiosk to display the relevant Chronograf dashboard.