Linking Grafana Alerting to PagerDuty

I wrote recently about monitoring our aquarium with InfluxDB and Grafana, including sending notification emails if something doesn't seem right.
Use of email for alert notifications is fine for most things, but some events demand much more prompt attention.
For example, water temperature drifting out of range isn't great, but isn't usually a "drop everything now" event and can wait until I next check email. However, a sudden sharp change could be indicative of something serious: perhaps there's a leak and the water level has dropped, or perhaps one of the heaters is stuck on and trying to boil the tank.
Although hopefully, they'll never be sent, I wanted to add the ability to create more intrusive notifications for cataclysmic events.
Like many in the tech industry, I already have the PagerDuty (PD) app on my phone, so it made sense to make use of that (the mobile app can sign into multiple accounts at once, which is really helpful).
I created a free-tier PD account and went through their initial setup wizard, the steps in this post assume that you've already done at least the same and have a functional PagerDuty account set up.
This post details the process I followed to link Grafana's alerting to PagerDuty and configure a policy to only route certain alerts to PD, along with some notes on things I found along the way.
Linking Grafana to PagerDuty
Grafana has out-of-the-box support for PagerDuty, so I assumed that linking the two would be quite simple. However, I was wrong.
It seems that PagerDuty have multiple types of API keys and only make one (the wrong one) easily discoverable in their web interface.
In the PD interface there's a Menu called Integrations with a menu item API Access Keys. This is the wrong one and if you try to use the key generated there, Grafana will receive a HTTP 400 from PagerDuty's API:

This caused some frustration.
The response code used isn't indicative of the fact that it's an authentication failure, HTTP 400 is supposed to mean that that there's something wrong with the framing or syntax of the request itself. However, the request was correctly formed but accompanied by an invalid token and so PagerDuty should have returned a 403:
The 403 (Forbidden) status code indicates that the server understood the request but refuses to authorize it.
This lack of correctness led to me spending far too long thinking that there must be some label or field which needed to be added to the test alert... grrr.
The key generated through the obvious route is an API key and what's actually needed is an Events API Key (a subtle distinction). Just to top it off, you won't find the events API mentioned in PD's interface until you're right on top of it.
After creating your PagerDuty account you should have created a Service and it's that that that needs to be edited.
- Click the
Servicesmenu item in the top bar. - Your service should be showing, if isn't, click the link to clear filters and it should appear.
- Click the
Morebutton to display the context menu:

From the menu, choose View Integrations and then click the Add Integration button.
When presented with a list of possible integrations, tick Events API V2

Scroll to the bottom and click Add to get back to the Service's integration view.
Click the cog next to Events API V2 and you should be taken to a page which displays the Integration Key (an alpha-numeric string).

Take a note of the key for use in Grafana.
Configuring Grafana
Now that we've got a Events API key, we need to configure Grafana. The way that it works is quite straightforward: we create an alert Contact that results in calls to PagerDuty's API.
In Grafana, click
- Alerting (the bell)
Contact PointsNew contact point
Enter a name for the contact point and paste your PagerDuty integration key into the box

If you click the Test button a dialog will open to generate a test alert. Add some fields and labels if you want
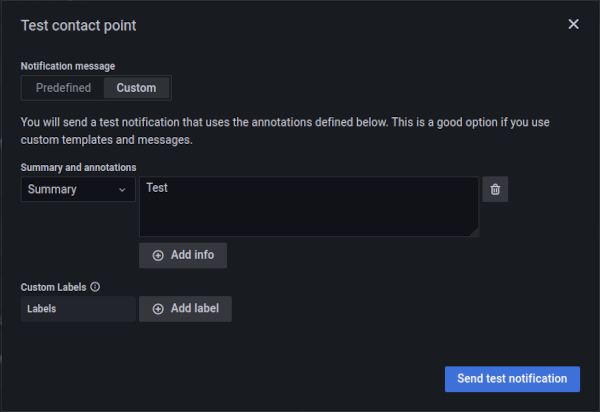
Click Send test notification and an event should be generated in PD
With that, you now have a Grafana contact point which can be used to route alerts to PagerDuty.
Notification Routing
When you first set up alerts in Grafana, you probably created a root policy, dictating where all alerts get routed. In my case, that's to my email contact

If you want everything to go via PagerDuty, you just need to edit that policy and have it use the newly created contact point.
However, I only wanted certain alerts to generate pages, so rather than changing the root policy, I created a Specific routing policy to send alerts to Pagerduty based on the presence and value of a label:
In Notification Policies
- Hit
New specific policy - Then
Add matcher - Set the matching rule to match anything with label
severityand valuecritical. - Set the contact point to be the PagerDuty contact

Having saved the notification policy, the relevant alerts need to be adjusted to include the necessary label:
- Alerts (the bell)
-
Alert rules. - Find the alert and click the pencil to edit.
- Scrolled down to
Custom labels - Added a label with name
severity(the interface is a little odd, when you click in it'll present a drop-down of available labels, if you're adding a new one just start typing your desired name and press enter). - Set the value to
critical(again, the interface is a little odd). - Save the alert.

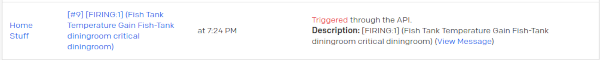
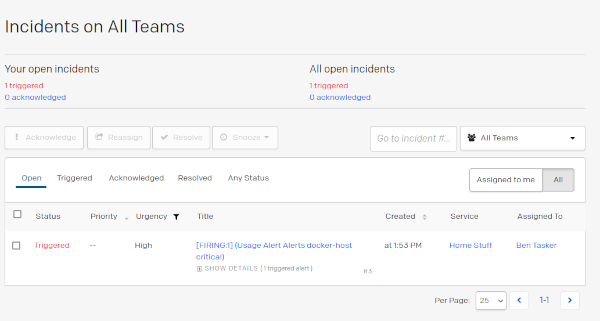
Now, when the alert triggers (or, in my case, a test alert is forced) it should result in a page in PagerDuty:
Any alert without that label will continue to use the root policy and not generate pages.
Making Events Re-Trigger after n minutes
Grafana now sends events to PagerDuty and PagerDuty will trigger pages until they're acknowledged or resolved.
It's good practice, though, to limit the amount of time that any given page can spend in an acknowledged state: doing so helps to ensure that pages aren't acked and then forgotten. After a period of time, acknowledged pages should re-open and re-trigger, re-paging and reminding.
This is one of those things that's really easy to configure, but only once you know what the platform actually calls it to be able to find the relevant documentation.
In this case, the setting is called Acknowledgement Timeout and is set on the service itself:
-
Services - Click into Service
-
Settingstab
You should see a screen like the following
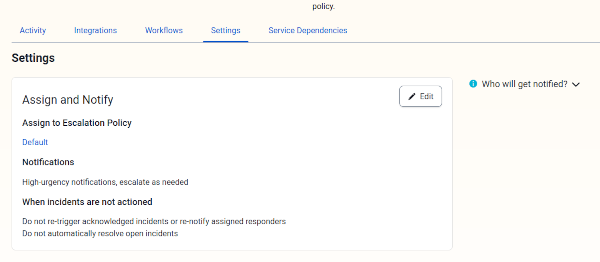
Click Edit in the Assign and Notify block and you'll be presented with some settings

Tick Re-trigger acknowledged incidents, set the desired interval and hit Save Changes.
Note: Editing Fired Alerts
Whilst messing about with setting all this up, I stumbled across a way to screw up during testing.
Normally, if Grafana considers an alert to be resolved a message will be sent to also resolve the PagerDuty event (at least, unless that behaviour has been explicitly disabled in Grafana's contact point config).
However, if you edit the alert whilst it's in a Firing state it will not then send a subsequent recovery message (presumably, the alert's current state is flushed out when you hit save), leaving the PagerDuty alert active.
So, if you do identify and correct a mistake in an alert's configuration, you should also manually resolve any associated PagerDuty events.
Note: Prevent Paging for Query Errors
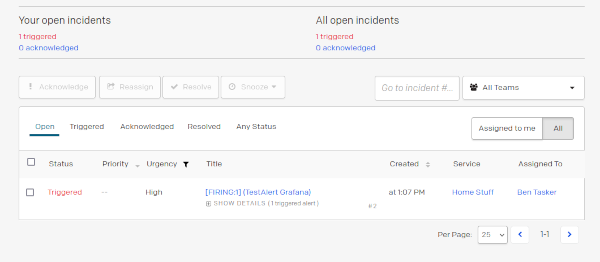
By default, if the alert's query fails, the alert will go into an Error state and generate a page:

This may not be desirable. For example, my database instance is automatically stopped once a week in order to take a filesystem backup, I don't really want to be paged at 2am when this happens and I've got seperate alerts configured for non-scheduled interruptions so the notification would be redundant at any other time.
An ideal solution would be to adjust the notification policy so that it doesn't apply to alerts with a status of DataSourceError (leading to the alert falling through to the root policy and an email being sent instead). Unfortunately, Grafana's notification routing doesn't support matching by alert state, so it's not possible to do this (I've put a FR in).
Instead, the desired behaviour needs to be configured in each alert.
Within the alert configuration is a section called Configure no data and error handling which, when expanded, allows you to set the state for the alert in the event of empty query responses or error

Overriding to set to OK means that these conditions will not result in pages the next time the query fails (or returns no results).
Conclusion
Configuring Grafana to communicate with PagerDuty is reasonably simple, the only real frustration being finding the relevant API key in PagerDuty's interface. Once you've got that though, it's pretty easy to implement policy based routing to ensure that more severe events are routed to PagerDuty.
In the examples above, the alert routing is based on a single static label - severity - but it is also perfectly possible to build a more complex setup, using templating to set label values and different contact points to route alerts to different services within PagerDuty (by extension, potentially paging different teams).
Although I haven't done it here, it's also possible to attach a "Mute Timing" to a notification policy so that it only applies at certain times of day (preventing unwanted overnight disturbances).
I appreciate that it's more than a little odd to be saying "yeah, so my fishtank can actually page me", but the exploration seemed worthwhile given that it might make the difference between saving fish and not. Hopefully, it never actually generates a legitimate page, although the integration will end up being tested periodically: during water changes the waterline drops below the temperature probe, resulting in the % change alert firing: